To say there’s a lot of uncertainty out there is a big fat understatement.
Yesterday afternoon, Fed Chair Jerome Powell announced that they will raise interest rates by another 75 basis points, our largest hike since 1994. The Fed is doing everything it can to get our economy back on track… without going off the rails.
On top of that, there’s still a war in Ukraine, inflation, supply chain issues, and an economic slowdown to deal with.
It’s remarkable how fast the pendulum has shifted from extreme bullishness last fall to despair and extreme bearishness now.
I’m hearing comparisons to 2008 and other large shocks to our system. On the other hand, I’m hearing optimists as well. JPMorgan’s head of macroeconomic research reiterated his target price of the S&P 500 at 4,900. That represents a 31% rise from here. He believes there will be no recession over the next 12 months.
With such starkly conflicting views, it’s tough to know what to do as an investor.
So in today’s essay, I’m going to go over a metric that I have been relying on heavily over the past few years: the Big Money Index (BMI). And using the BMI, we’ll take a look at what we can expect from the markets in the coming months…
The BMI Is Leveling Off
As a reminder, the BMI is a gauge of institutional money flows moving in and out of stocks. I built it to take all unusual buy and sell signals and smooth that data over a 25-day moving average. When the BMI rises, we know money is moving into the market. When it falls, money is coming out.
Over the past year, this is what it looks like:

We can see it’s been quite choppy but in line with the stock market as a whole.
There are clear correlations between the BMI rising along with the price of the SPDR S&P 500 ETF Trust (SPY). It’s important to note that if the BMI rises above the red line, stocks are overbought. And when the BMI dips below the green line, selling becomes unsustainable, and the market is oversold.
When the BMI goes overbought, we can expect stocks to fall after, and when the BMI goes oversold, we can expect stocks to rise. This is based on 32 years of data history.
So when the BMI fell below oversold on May 24, I alerted everyone to expect stocks to rise and bounce.
And like clockwork, it happened: the SPY rose 9.8% until it peaked near term on June 2. Relieving as that was… it was short-lived.
So what is the BMI telling us now?
As we can see in the chart above, the BMI has leveled off and even dipped a little. That is not surprising given how much stock and ETF selling we’ve seen in the past few sessions.
We can see the selling in these two charts:

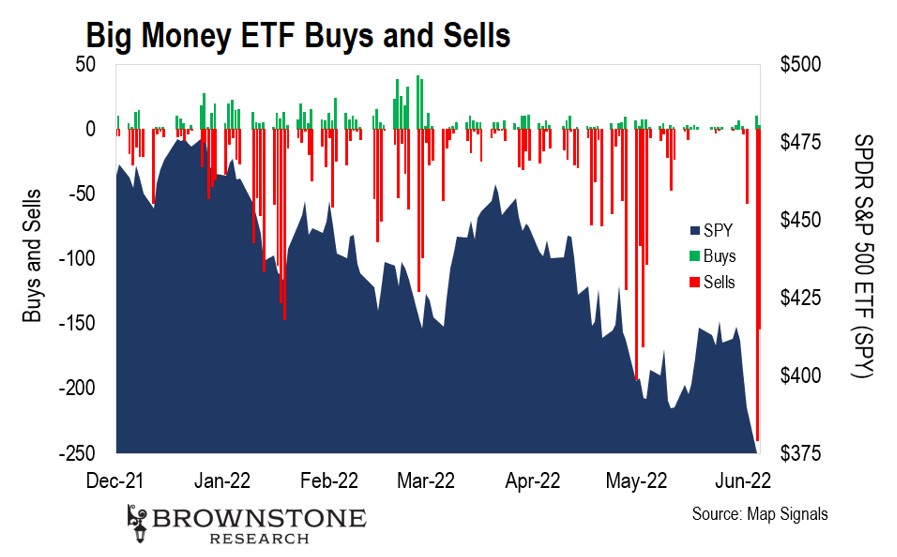
Those big red bars mean a lot of fresh selling. Several of the past few trading sessions prior to yesterday’s lift have been miserable.
This would indicate that the BMI is likely going to start falling again. Given the new 0.75% bump to rates, we’ll likely continue to see some volatility for the near term – at least until the fourth quarter of this year.
Yet we should keep some perspective, especially when comparing today to downturns in the past…
Is This Another 2008?
As I mentioned above, some people are going so far as to compare our current moment to 2008 during the Great Financial Crisis.
So let’s look at what the BMI looked like during that time:
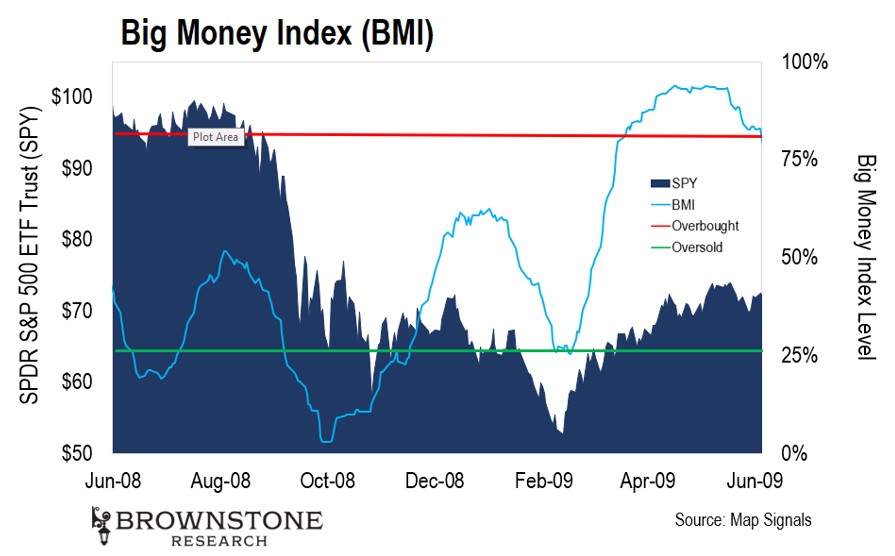
During the summertime, the BMI went oversold… and then rose as investors stepped in to buy stocks, not yet grasping the gravity of this situation at that time.
The mortgage market was simmering and ultimately popped in the fall. That caused the BMI to go oversold again. The selling was prolonged and lasted almost the entire fourth quarter of 2008.
Once that selling finally concluded, the BMI started to rise.
Stocks stabilized for a few months and ultimately hit lows in March 2009. The BMI at that point just kissed oversold. And from there, the market never looked back. The BMI quickly rose to overbought conditions.
Naturally, new news can unfold, but we aren’t in a 2008-style credit crunch yet. And the current circumstances are different enough from 2008 that I certainly don’t believe there’s any reason to panic about a crash.
But I do expect we’ll see continued BMI volatility. That’s the bad news.
The good news is that the BMI correlates to the entire stock market – but there are trends happening underneath. And following the Big Money often leads us on unexpected paths to profits.
Relentless Buying and Tremendous Selling
For years, the biggest and brightest investors were buying technology stocks, while energy stocks were languishing. But in 2022, the story has been quite different.
In fact, as we discussed on Tuesday, we’ve seen relentless buying in energy stocks since January:

But to offset that, we’ve seen tremendous selling in technology stocks at the same time:

The energy price squeezes are temporary in nature. It’s difficult to imagine a world in which gas prices stay this elevated for the long term.
Yet over the next few months, I do expect gas prices to stay high. And with high prices come higher profit margins for energy companies. The smart money foresaw this early in the year and positioned for it.
So near term, energy stocks are still a great inflation hedge. If you’re going to pay more at the pump, you may as well own the companies profiting off of your spending.
That said, with technology getting relentlessly sold, the long-term investor should be looking for bargains.
Our reliance on technology will only increase, not decrease.
And while shopping for beat-up tech shares now may not provide you profits immediately, it’s a great opportunity to set up for big rewards in the future.
One needs to look no further than the large-cap providers of the technology products and services in our everyday lives that will continue growing for years into the future.
So those are two ways investors can play the current moment depending on our time horizon.
Look to 2023
The BMI is volatile right now, as is the stock market. Right now, fear has the wheel and is usually a reckless driver.
But one thing I am certain of is that eventually, the BMI will start rising from oversold and not look back for a while. Stock prices will follow suit, and order will be restored.
As for when that happens? It’s my view that in the fourth quarter of this year, stocks will start to lift and set us up for a tremendous 2023.
Supply chain struggles should be easing by then, while the labor force resumes more normal operations. We’ll also have less fiscal uncertainty about rate hikes once the Fed finishes engineering its “soft landing” – which I expect it to be well on its way to doing by the end of this year.
Likewise, I expect we will near, if not reach an end, to the war in Ukraine by then – or if not, we’ll at least have figured out solutions to some of the shortages caused by the war.
All of these factors will put us on a much stronger footing.
So while there’s lots of uncertainty right now, let’s keep calm and continue to ride out the choppiness. I expect by this time next year, we’ll hardly remember our current worries.
Talk soon,
Jason Bodner
Editor, Outlier Insights