


The Remarkable Success of the Reactor Pilot Program
The DOE’s Reactor Pilot Program has already proven absolutely incredible for innovation in the private industry for the fourth...
So today, I’ll prove to you that making it as an investor is much more about having a long-term perspective. And as a bonus, I’ll show you why I think the market is primed for huge gains ahead.

I bet you never thought a yellow traffic light can sum up human and investor behavior. But hear me out…
When traffic lights rolled out in 1868, caution lights weren’t part of the plan. Yellow lights didn’t even exist until 1920.
Green suddenly changing to red must have caused loads of crack-ups. So a Detroit police officer, William Potts introduced it to warn drivers of a coming red light.
The idea was for people slow down when they see a yellow light, so they don’t mistakenly run the red. But we all know how that usually goes.
Most of us just gun it, and fly through just before the light turns. The satisfaction of beating a red is undeniable. That’s because usually, all we care about is getting somewhere quickly.
Ironically, that’s exactly when we’re most like hardcore Wall Street risk managers. Instantly, questions start streaming through our brains: “Are other cars crossing the intersection? Pedestrians? Cops nearby? Will I make it?”
But when we’re forced to slow down because we know we can’t make it, the need for immediate high-risk decision-making goes out the window.
Investing can be like trying to beat that yellow light. Look, I bet if you ask the average person about their long-term investing plans, most don’t have a clue about their risk or portfolio concentration. And if they use a financial adviser, they may not even know what stocks they own!
Yet, if you told those same investors some sketchy penny stock was sure to double, they’d likely buy it before you finish the sentence… They want to beat that yellow light.
So today, I’ll prove to you that making it as an investor is much more about having a long-term perspective. And as a bonus, I’ll show you why I think the market is primed for huge gains ahead.
And of course, I’ll do that the best way I know how: Reading the data.
They say patience is a virtue. But we know it doesn’t come naturally for most of us – whether it’s sitting at intersections or investing. In both cases, we just want to get there (or get rich) as fast as possible.
But the older I get, the more I realize patience is key. That’s why, when I’m making an investing decision, I dig deep in data to give me as clear a picture as I can get of the landscape.
As you may know, this process leads me to find outlier stocks – those tiny 4% of stocks that account for 100% of stock market gains over bonds for the last 100 years.
But you may not know that my process can also help figure out the market’s next moves. And while it may be fun to blow through a yellow light looking for a quick buck, my process focuses on safely having the most money whenever I finally get there.
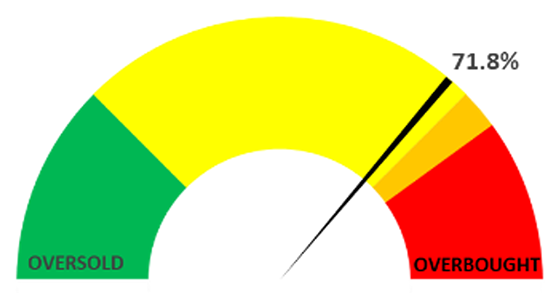
To help me do this, I created an indicator that helps me know if a market is overbought, or even better – oversold.
It’s called the Big Money Index (BMI). It measures the number of big money stock buy and sell signals I see coming in from major Wall Street institutions. Then, using a 25-day moving average, I’m able to smooth out these buys and sells into a usable market indicator. Think of it at the “temperature gauge” in your car. Only it looks like this:
Mapsignals.com
The BMI charts on a 100-point scale, reflecting what percentage of Big Money buy signals my data detects. When the BMI is rising, Big Money is buying. When it’s falling, Big Money is selling.
And when the index crosses above the 80% level, stocks are overbought: We should expect a correction. When it goes below the 25% level, stocks are oversold and it’s time to go shopping.
With that in mind, let’s see what the BMI says about stocks – right now, and over time…
I might get a little bit technical here, but it’s important to understand how this data can help your investing.
Below is a 31-year chart of the BMI. Now, on this timeframe, it doesn’t seem to tell us much. We see a lot of bouncing up and down between overbought and oversold conditions…

But once you look deeper, there’s much to uncover.
First, the chart shows the BMI spent more than 75% of its time between overbought and oversold.
The BMI has been overbought only 20% of the time. These are times you want to be lightening up on stocks and expecting a correction.
But those rare oversold instances are the golden tickets. The BMI spent only 3.7% of its time oversold. Deep discounts are rare, and rarely comfortable. But that’s when you need to load up on outlier stocks.
Now I told you when the BMI is rising – Big Money is buying. But should we automatically expect rising stock prices? It makes sense… As Big Money rushes into stocks, they should go up, right?
Let’s again look at the long-haul data…
Over 31.25 years (7,876 days), the BMI rose only less than half the time – 47%. But on those days, the S&P 500 rose with it for 67% of that time (2,474 days).
In contrast, the BMI surprisingly fell 53% of the time. And on days where it fell – the index fell with it 58% of the time.
Fast forward to 2021… And so far, the BMI spent only 25 of 67 days rising. That’s 37%.
Now, let’s take a quick look at the BMI today…
In the chart below, we see that so far this year, the BMI is below average in terms of time spent rising. But it’s rising now. And as it rises, we can expect nearly 70% of the time that stocks will rise with it.
This is very bullish…

Now before skeptics tell me “but indexes usually go up,” check this out…
Over the same 31.25-year span, the S&P 500 rose only 53.5% of the time. Those are fine odds for a casino, but hardly great when trying to fly through a yellow light unharmed.
But a 70% chance that stocks will rise like we’re seeing now? Those are great odds in the market. And I’ll take ‘em!
Right now, the BMI says higher highs are coming. And my approach is to find the outliers, so my subscribers can to do even better than the market.
Nothing is ever certain. But, because I use the Big Money Index history as my guide, I know the odds are in my favor. And it tells me now it’s time to get bullish.
So, the next time you feel like rushing to beat that yellow light, try to think of this:
Two things separate high-risk short-term gains from low-risk long-term gains… Patience and process.
You might get lucky once or twice by trying to score a home run win in short time, but simply playing the long game is a proven way to building sustainable wealth. As they say, timing the market almost never beats time in the market.
(It’s also a lot less stressful!)
Regards,
Jason Bodner
Editor, Outlier Investor
P.S. As you may know, I recently joined Brownstone Research and launched a brand-new trading advisory called Outlier Investor.
In it, my mission is to uncover outlier stocks – the 4% of stocks that have made up most of the stock market’s gains for the past 100 years. And I use my proprietary Big Money system to do it.
You see, when Big Money buys stocks with superior fundamentals and long-growth runways, that’s a rare combination. And to me, that’s the perfect signal to invest.
To learn more about my unique approach to finding outlier stocks, just click right here…
Like what you’re reading? Send your thoughts to feedback@brownstoneresearch.com.
Read the latest insights from the world of high technology.
The DOE’s Reactor Pilot Program has already proven absolutely incredible for innovation in the private industry for the fourth...

There has certainly been no shortage of excitement in growth assets and the tech industry…

There is another type of cage match playing out in Washington right now… The bare-knuckle fight between CFTC Chairman...