

Tokenmaxxing: The Weird AI Trend Investors Are Overlooking
The practice of using as many tokens as possible is called “tokenmaxxing.” And it’s taking over Silicon Valley.
Jeff Clark is set to reveal what he believes is the most reliable strategy of his career… A “strange market phenomenon” he’s calling the 44-Day Retirement Accelerator. During testing, he had a 95% win rate, doubling his money in 45 minutes… and believes you can do the same…

Van’s note: Van here, Jeff Brown’s longtime managing editor. At The Bleeding Edge, we bring our readers the very latest advances in the world of technology. But once in a while, we like to feature exciting ideas and insights from other experts.
Today, we hear from our friend and colleague Jeff Clark. Jeff is one of the best short-term traders I’ve seen in my years of financial publishing.
And he is set to reveal what he believes is the most reliable strategy of his career… one that during testing gave him a 95% win rate… and doubled his money in just 45 minutes.
Next week, he’ll speak on a “strange market phenomenon” that he’s calling the 44-Day Retirement Accelerator.
No matter what’s happening in the stock market, Jeff’s proprietary calendar can tell him ahead of time which stocks are pre-determined to see big moves. What’s more, the next 44-day window opens up on May 11 – the night of Jeff’s webinar.
If you’re interested in joining Jeff on Wednesday, May 11, you can sign up right here. And read on to hear about Jeff’s “Dirty Sock” approach to trading…
Today, I’m going to share some unconventional wisdom that should change the way you approach trading.
You might be a little skeptical at first.
But I can assure you… By using it, you’ll be able to double your money over and over no matter what kind of market we’re in.
Try thinking of trading the way I do… A chart of a stock (or index) is simply an emotional picture of the stock at a specific moment in time.
Stock charts tell me how traders/investors are responding emotionally at any given point in time.
Human emotions are remarkably consistent. We tend to respond the same way, over and over again, to the same circumstances.
In the same way, the market is emotional. It evolves over time.
So, conditions that used to provide a catalyst for a big move may need to get more extreme to cause a similar movement the next time.
Think about it this way…
When I first got married, I’d often come home from work, take off my socks, and drop them on the floor next to the couch in the living room. My wife would come home, see my socks on the floor, and get all ticked off about it.
In other words, she’d have an emotional reaction to her husband leaving his socks in the middle of the living room floor.
This happened over and over again.
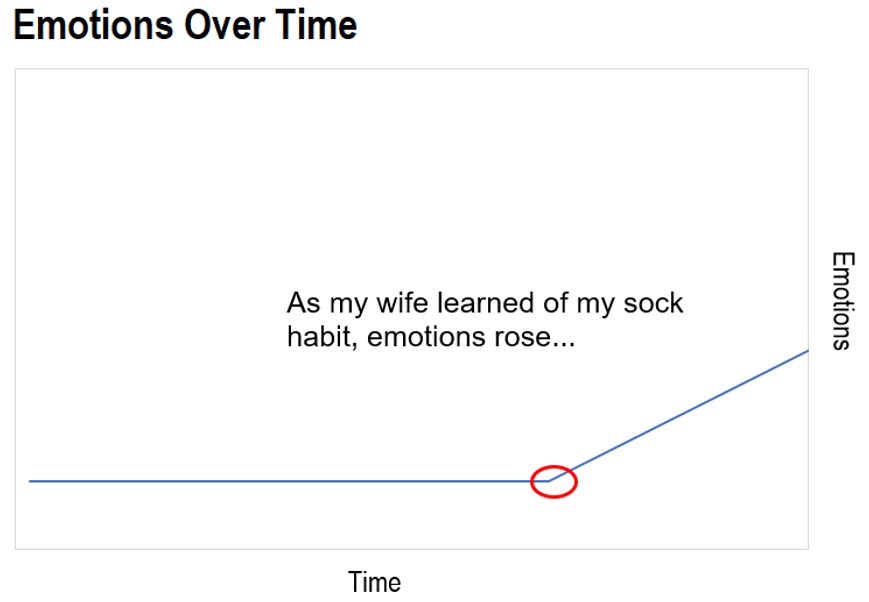
Now, think of how this reaction would look on a typical stock chart…
It’d start with a line trending sideways – my wife’s emotions before she knew all about my sock habit. You’d see the line climb as my wife got more and more frustrated…
Eventually, though, my wife got a little better about dealing with her slob of a husband, and I got a little better about not leaving my socks next to the couch.
Leaving my socks on the floor no longer elicited the same reaction from my wife.
She still had the same emotions. But she had adapted. She had evolved.
She suppressed her emotions and would need a bigger catalyst before getting upset with me again…
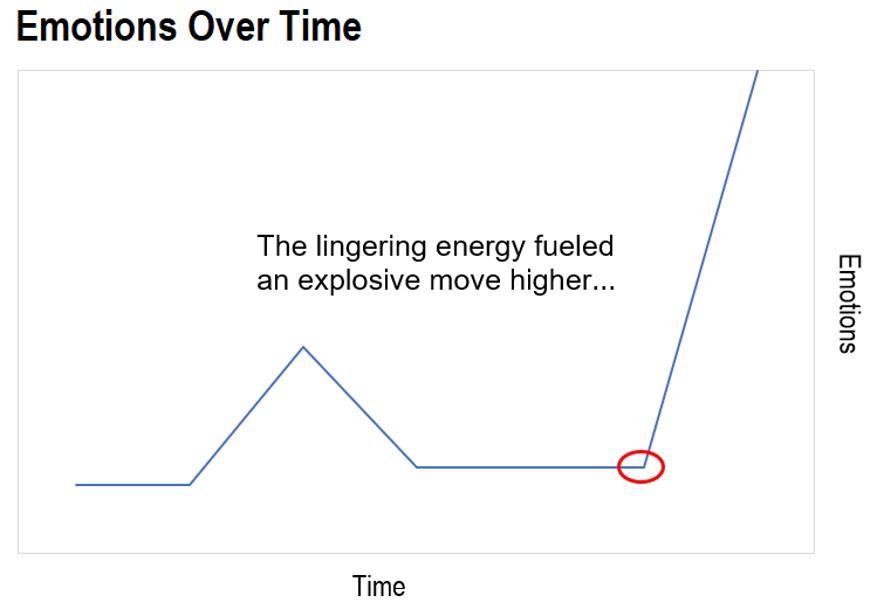
Over on the chart, things have calmed down.
The line on the chart is headed sideways, with little action in either direction. There’s less volatility.

But in the background, energy is building. Those dirty socks had to be going somewhere… and it wasn’t the hamper.
Remember, human emotions don’t change. They’re remarkably consistent. But, emotions do evolve and sometimes it takes a bigger catalyst to elicit the same response.
That catalyst was provided when my wife was vacuuming one day and moved the sofa in order to vacuum the carpet beneath it.
She found about a dozen pairs of my dirty socks tucked beneath the couch.
Boom!
You can guess what happened next on the chart…
Here’s my point…
A stock chart is simply the emotional representation of investors’ reactions to the stock.
If you know how to spot the right catalyst, you can make a killing as the pattern plays out.
And that’s exactly what I’ve been working on over the past six months…
I’ve created a calendar that maps out potential catalysts just before they happen, giving traders the chance to take advantage with options.
It’s simple, you get in on the right date… a date you know ahead of time, so it’s very predictable…
Then you get out a few days (or hours) later for a quick profit.
During my testing, I’ve personally been able to double my money in about 45 minutes… with a 95% win-rate.
And we’re set to receive a flurry of similar opportunities this year…
According to my calendar, these events will start rolling in as soon as May 11. To help prepare you, I’m hosting a special presentation that evening.
During the presentation on May 11, at 8 p.m. ET, I’ll share three stocks from my calendar to keep an eye on.
And you’ll be able to gain access to my exclusive new strategy.
Simply click here to reserve your spot.
Best regards and good trading,

Jeff Clark
Like what you’re reading? Send your thoughts to feedback@brownstoneresearch.com.
Read the latest insights from the world of high technology.
The practice of using as many tokens as possible is called “tokenmaxxing.” And it’s taking over Silicon Valley.

Just how far off are humanoid robots from “human-level” productivity?