


The Truth About the “AI Bubble”
The business of artificial intelligence is real… It’s grounded, and it’s the definition of exponential growth.
There are clear signs that growth stocks are about to come back in style…

Have you ever felt like your investments are holding you hostage?
I’ve had this feeling, especially recently.
You see, I devote my time to identifying outlier stocks. By my measure, outlier stocks are companies growing sales, earnings, and profits… But, most importantly, they show signs of investment from big institutional money.
Over time, I have found no better long-term wealth builder than buying and holding outliers. And most often, outliers are growth companies.
But it’s not always smooth sailing. Lately my growth stocks have been red while everything else is green – even though I know they’re the best companies out there.
It reminds me of Roman general and politician Marcus Licinius Crassus. He created the first Roman fire brigade.
Whenever a fire broke out in Rome, the fire brigade would swiftly appear. The issue was, before dousing the fire, Crassus would first offer to buy the burning building at a dirt-cheap price.
If you sold, the fire was put out. If you refused… the brigade just let it burn.
When my stocks sink while everything else rises, I feel like I’m faced with the “fire brigade” choice. Do I watch my portfolio burn and wait to rebuild? Or do I sell my stocks at dirt-cheap prices to a “rescuer”?
It took ages to learn that it’s best to keep a calm head and wait for the fire to pass. Even if my stocks go to sickeningly low levels, I believe in my work. I know the companies will rise again like a phoenixes from the ashes. But if I sell them to the fire brigade, I’ll make a big long-term mistake.
So today I want to show you how I keep my conviction when the market seems to be missing something I’m not. I’ll do that by diving deep on one of my most trusted market-timing tools… And showing you what sectors it says to buy right now.
When my portfolio fire broke out in March, and the fire brigade came knocking, I immediately knew to ride it out.
Growth stocks were getting pounded in favor of “the reopening trade.” Software stocks in particular, which enjoyed a massive rebound after the 2020 crash, were suddenly pariahs.
The mainstream message was “everyone will go outside… And demand for software products will wane.”
Of course, I don’t only own software stocks, but the ones I do were getting hit hard. Along with pretty much anything that had a phenomenal growth metric.
The big picture was: prior growth areas will cool… And prior battered sectors will rise to new growth.
This makes perfect sense, but I also learned to tune out the big news drivers.
The media can (occasionally) be spot-on and dictate price movements in the short term. But long-term, I stick with my winning formula.
Here’s why I’m telling you all this: It appears that waiting out the fire will prove worth it yet again. And I’ll prove it to you the best way I know how – digging into the data.
Looking at the past couple weeks of data, we see a relatively unchanged stock market. The S&P 500 has risen just under 1% since Friday, May 28.
My proprietary Big Money Index (BMI) – which measures unusual institutional buying – was equally flat, and has been for a few weeks…

Veteran readers will know the BMI is a 25-day moving average of all buying and selling signals according to my data. It helps identify overbought and oversold markets with great accuracy. When the number of buy signals reaches 80% of all Big Money signals, the market is in an overbought state. When it falls to just 25%, the market is oversold and due for a rebound. You can clearly see this dynamic at work in the chart above.
But despite being a leading indicator, the BMI carries a timeframe lag – meaning, we must wait for 25 days of data to calculate our readings.
So, if we look at shorter timeframes, we might be able to predict where the BMI will go in the shorter term… Thus helping us predict where the market will go.
So, the normal 25-day BMI has flatlined for weeks. That usually means nothing exciting for the near future.
But the last ten days have shown a big ramp-up in buying with a sudden vacuum of selling. That means the 10-day BMI is lifting fast, but not fast enough to show up in the BMI we normally look at.
In other words: the BMI is about to lift. And when that happens, we usually see higher prices in the type of stocks big money loves – namely growth stocks.
Check this out:
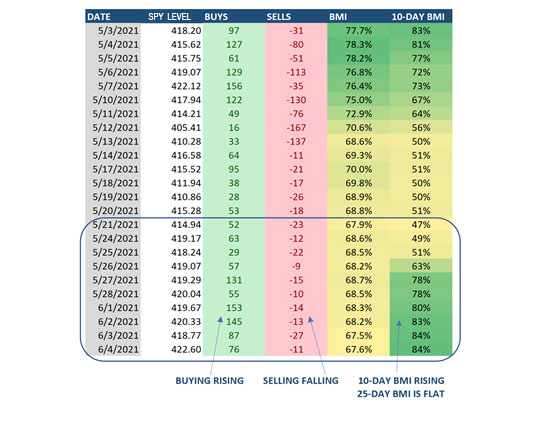
The table above shows the total number of buy signals generated by my system each day. It shows the number of buys, the number of sells, and the resulting BMI both on its standard 25-day and short-term 10-day timeframes.
As you can see, buy signals are rising… Sell signals are falling… And the short-term BMI is showing bright green. This tells me that the market is preparing for another big leg higher.
So that’s good news for growth stocks. But which growth sectors should you be in right now to take best advantage of this trend?
To answer that, let’s take a look at my sector ranking list. This shows the number of Big Money buy and sell signals across every major market sector. It’s a good way to learn where the Big Money is flowing, and find good long-term investment opportunities.

Right now, the Real Estate and Energy sectors are attracting the most Big Money attention. And while these don’t seem like traditional “growth” sectors at first, this makes a lot of sense…
Nowadays, energy companies don’t necessarily mean just oil or natural gas companies. The rise of electric vehicles and a huge push for renewable energy from the Biden administration is bringing diversity and a whole lot of capital into the energy sector.
In fact, in a recent essay I outlined why Elon Musk suddenly did an about-face on his bitcoin investment, and how this was likely linked to his top priority of making Tesla the center of the renewable energy universe.
Personally, I would suggest playing the renewables side of this trend. While oil companies aren’t going away anytime soon, the renewables space has both long-term legs and a huge incentive to outperform over the next few years – as Washington gets serious about making the U.S. carbon-neutral. The Invesco Solar ETF (TAN) is a great place to look to take advantage of this.
As for real estate, one only needs to look at the blistering rise in home prices to see why it’s attracting Big Money. Interest rates are at or near all-time lows, and the U.S. is in the middle of a huge land and property rush as people look to hard assets as an escape from what many perceive to be a depreciating dollar.
In my view, though, the best way to take advantage of this is through real estate investment trusts (REITs). REITs are essentially funds that hold a lot of investment properties. They tend to pay large dividends. And, as I outlined a few weeks ago, REIT dividends are taxed as ordinary income.
This would make them an attractive place to park capital in the event of higher taxes, which the president has proposed. Investors could benefit from buying the overall sector through an ETF like the iShares U.S. Real Estate ETF (IYR).
In sum, below-the-surface buying is about to power the market higher. And we’ll likely see those gains in current outlier sectors like Energy and Real Estate.
So if you’re a growth stock investor and have been confused by the recent price action, be patient. Our time is fast approaching…
Regards,
Jason Bodner
Editor, Outlier Investor
P.S. As you may know, my system is much more than the Big Money Index…
It also happens to be a highly advanced stock-picking “machine” that tips me off to potential outliers every single week. And I pass along the best of these potential outliers to my subscribers.
Right now, with the growth stock universe recovering from its downturn, there’s no better time to invest in the type of stocks I recommend. So to learn more about how my system works, why Jeff Brown asked me to join Brownstone after he saw it, and how you can get your hands on it… click right here.
Like what you’re reading? Send your thoughts to feedback@brownstoneresearch.com.

Read the latest insights from the world of high technology.
The business of artificial intelligence is real… It’s grounded, and it’s the definition of exponential growth.

We are now entering a world of permissioned AI use. And it’s fueling conversations around alternatives.

According to Market Wizard Larry Benedict, the SpaceX IPO is just the latest sign that the market is rigged...