

Don’t Fall for the Semiconductor Selloff
SMH fell 6.4% in the three days following the Kimi K3 release. Here’s why you shouldn’t worry…
Some markets sell off for reasons. Other times, they just need an excuse.

By Jason Bodner, Founder, Outlier Intel
“Carnage in Chip Stocks” is how The Wall Street Journal described it.
From WSJ:
The tech-heavy Nasdaq fell 4.2%—more than 1,100 points—in its worst decline since the tariff rout of April 2025. Micron Technology, Intel, Super Micro Computer and Sandisk lost more than 11%. Cisco and Nvidia both dropped more than 6%. Equipment maker Caterpillar, lately an AI play because of its power and energy business, fell 3.8%.
Last Friday might have felt like a crash. It was not. It was a pressure release.
Painful? Sure.
Healthy? Absolutely.
Since the April lows, the AI-fueled equity trade has been the hottest in history. Stocks like Micron (MU) and Sandisk (SNDK) went moon bound. They’re up 166% and 175%, respectively, since April.
Historically, it’s scary when stocks shoot higher like this. It brings memories of the dot-com and crypto bubbles, which were powered by hopes and dreams rather than profit and margin expansion.
That’s not this rally…
The AI run is based on strong fundamentals. And it’s still very much intact.
The recent stumbling block was Broadcom’s (AVGO) earnings, which was reported after Thursday’s close.
The numbers beat. AI revenue more than doubled year over year to $10.8 billion. But CEO Hock Tan held 2026 AI semiconductor guidance steady rather than raising it.
The company also announced a shift to chips-only delivery instead of integrated systems. The market took both as disappointment. The AI hardware complex, after months of one-way upside, finally got a reason to pause.
Then, the jobs report surprised to the upside. The U.S. added 172,000 jobs in May, the report read. That’s more than double the 80,000 expected.
A stronger job market gives the Federal Reserve the cover to raise rates if it feels it has to. And considering the latest CPI print was on the warmer side—3.8% topline and 2.8% core—the market is thinking the Fed might have to.
All this, combined with a market that was overbought according to the Relative Strength Index (RSI), means a pullback was warranted.
But let’s put this into context…
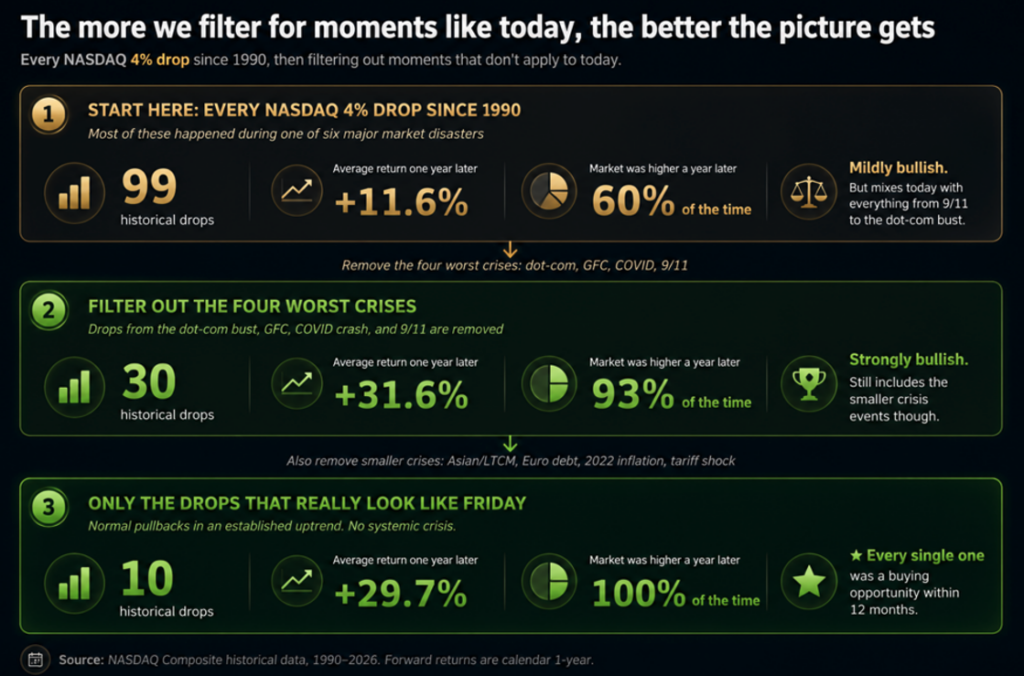
Since March 30, the Nasdaq rose 30%. The 4% drop on Friday means the index is up “only” 24% since the March lows. That’s still epic by any measure.
And here’s the part that will surprise you: Historically, one-day drops of this magnitude are actually bullish.
Since 1990, the Nasdaq has seen ten trading days with a fall of 4% or more. Outside of systemic crises, the index was higher twelve months later every single time, averaging +29.7%.
Have a look at some of the data below.
Some markets sell off for reasons. Other times, they just need an excuse. The Broadcom earnings and the jobs report were all the excuse the market needed to puke.
Friday felt like a crash. It was not.
Today is not 1999. It is not 2008. It is not 2020. It is not 9/11. It is, however, a pressure release inside an established uptrend funded by real earnings.
By Joe Withrow, Senior Analyst, Brownstone Research
$8,900 by 2030…
That’s the updated price target for gold provided by wealth management firm Incrementum AG.
The reason for the update: The metal’s already blown past the first target…
In 2020, the firm’s partners made a projection that became widely cited. They predicted that gold would reach $4,800 per ounce by 2030.
Gold was trading around $1,800 when the target was published. Few investors were interested in the asset. Yet, this investment firm based in Liechtenstein was saying it would nearly triple over the next decade.
It was a bold call…but not bold enough.
Gold ripped through the $4,800 level earlier this year. The metal broke just above $5,300 before pulling back modestly.
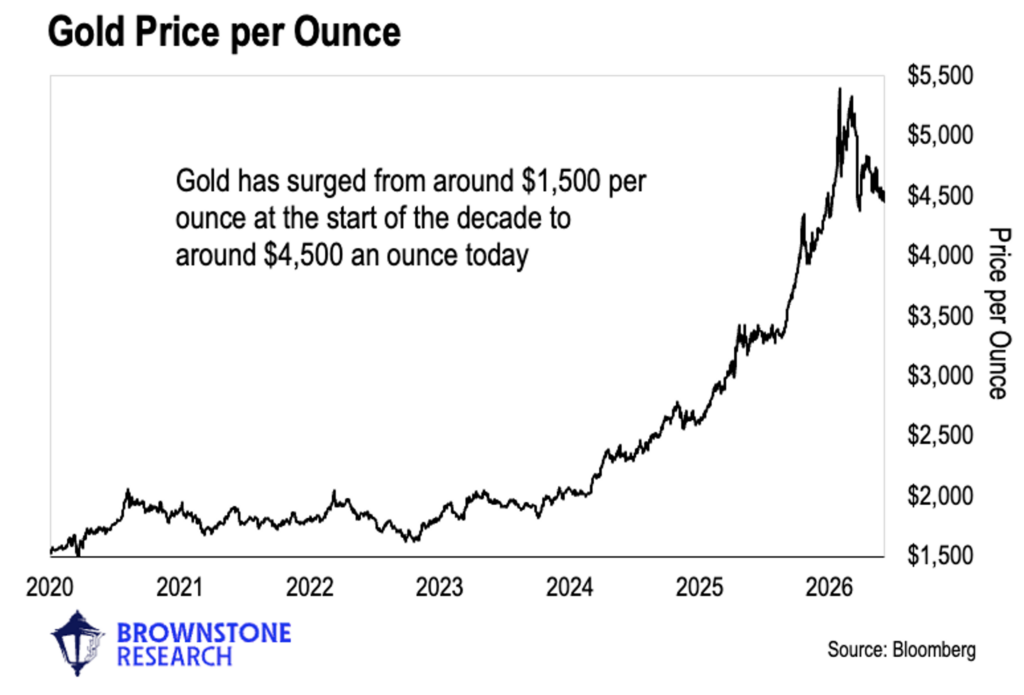
Now, Incrementum AG is back with a new target in the firm’s 2026 edition of its In Gold We Trust report, published last week. The partners raised their decade-end projection for gold to $8,900 per ounce.
Incrementum lists a few tailwinds for the metal…
Reserve function & sovereignty: Gold is emerging as a sanctions-resistant, sovereign reserve asset and neutral store of value, especially for non-Western central banks diversifying away from traditional fiat reserves.
Accumulation (Western central banks): After decrying gold as a “barbarous relic” for decades, Western central banks are now adding to their gold reserves for the first time in over 10 years.
According to BullionStar’s analysis, a “moderate rebalancing” by Western central banks alone could generate 2,000–3,000 tonnes of new demand for gold. Yet, the annual mine supply globally is only 3,600 tonnes.
That means central bank buying could generate demand equivalent to 55–83% of total annual mine production. This dynamic represents a major structural shift in the market.
Private and institutional demand: Gold is gaining strategic importance as a store of value, with institutions and private investors rediscovering it amid eroding trust in fiat systems.
JPMorgan is now recommending a 4-5% gold allocation to private clients. And Morgan Stanley is going so far as to recommend a 60/20/20 portfolio – 60% stocks, 20% bonds, and 20% gold. We will see private demand increase accordingly.
Accounting & recapitalization: Given the price surge, gold could now serve as a silent recapitalization option for central banks and governments that have accumulated excessive sovereign debt.
Consider this – many central banks still carry gold at historical cost rather than at market value. For example, the US Treasury values America’s gold reserves at $42.22 per ounce. That’s even with gold trading around $4,500 an ounce as I write this. If the US Treasury revalued its gold, nearly $1.2 trillion would suddenly appear on the balance sheet – making the government’s fiscal situation look less dire.
Anchoring in credit markets: There’s a growing push to create “gold-backed bonds” as a means to help restore trust in over-indebted systems like the US Treasury market. Former Federal Reserve nominee Dr. Judy Shelton wrote a book on the subject and has been doing a media tour promoting the idea.
Digitalization / Tokenization: And on the technological front, several prominent projects are working to “tokenize” gold to make the metal far more mobile, tradable, and seamlessly integrable into modern financial infrastructure.
The tokenized gold market has exploded this past year, with trading volume hitting roughly $178 billion in 2025. And Tether alone has been buying physical gold at a pace rivaling major central banks to back its XAUT digital asset.
The gold market is changing.
For the past three years, the marginal buyer has been smaller central banks in emerging markets and retail physical bullion investors. Western institutions, which control the largest pools of capital in the world, have been largely absent… but that’s now changing.
With Western central banks and private institutions entering the market, there’s likely a strong floor undergirding the gold price here in the low $4,000 range.
By Clint Brewer, Research Analyst, The Opportunistic Trader
Software stocks were left for dead earlier this year.
The iShares Expanded Tech-Software Sector ETF (IGV) tracks the sector and was down as much as 27% into February.
The drop stemmed from fears over advances in artificial intelligence (AI) applications, where AI could serve as cheaper alternatives to software products and disrupt lucrative SaaS business models.
But just as it looked like software stocks would never find a bottom, something surprising happened—they rallied. As I write, IGV is up approximately 35% from the mid-April lows.
The snapback might have surprised many investors, but it wasn’t unpredictable. In fact, the team at The Opportunistic Trader did predict it.
Here’s what our founder, Larry Benedict, told readers on March 2:
Bitcoin and software stocks have been highly correlated since at least late 2024. Their directional movements have been closely aligned since then.
[…]
Not only did Bitcoin fail to confirm the most recent low in IGV, but Bitcoin is also receiving a positive signal from the Relative Strength Index (RSI). The RSI is making a higher low as Bitcoin tests the lows from early February. That shows downside momentum is fading.
If we see a strong reversal higher in Bitcoin off these levels, that could point to a big rally coming soon in software stocks.
Comparing software stocks to Bitcoin may seem odd, but it’s a strategy known as “intermarket analysis.” That’s when you utilize correlations across different sectors to confirm a trend and spot potential reversals.
And as Larry mentioned, Bitcoin has been the perfect indicator for tipping off big moves in software stocks.
There are likely several reasons why Bitcoin and software stocks would be highly correlated.
Both groups are sensitive to the outlook for liquidity and financial conditions, where factors like the outlook for interest rates play a big role. Also, Bitcoin and software companies could both face existential threats from developments around AI.
Bitcoin and software may also share a similar investor base enticed by high growth, making both sensitive to changes in risk-on and risk-off sentiment.
Whatever the case may be, Bitcoin tends to lead changes in trend among software stocks and IGV.
Let’s look at a chart to prove my point. Below, you’ll see Bitcoin (blue line) along with IGV (black line) going back to last April.
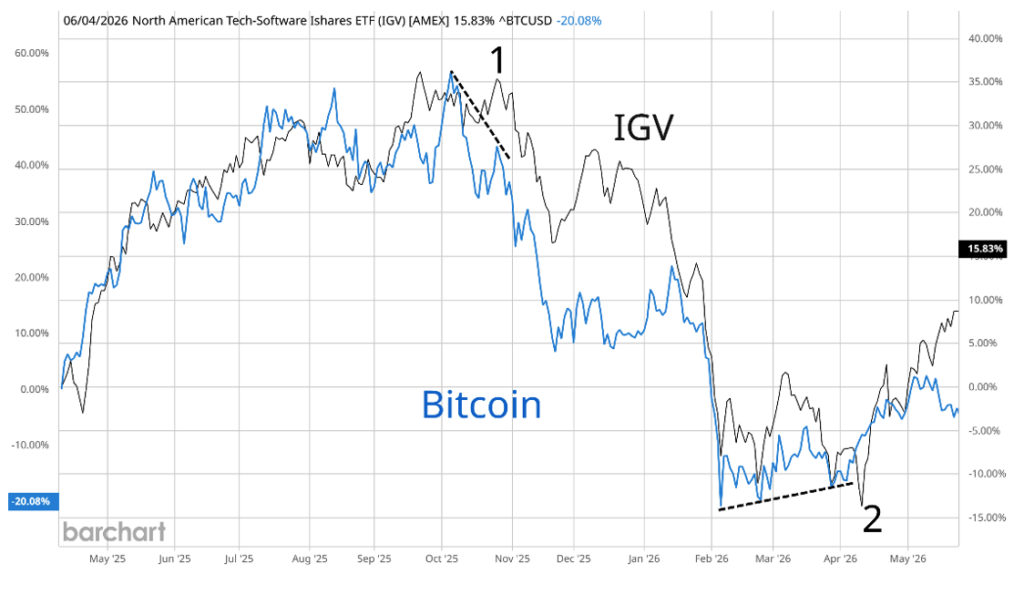
You will notice a positive correlation between the two lines as they move together, but Bitcoin will often diverge from IGV at key turning points.
That includes point 1, where IGV made a double top in price while Bitcoin was already turning much lower, as shown with the dashed line. That price action in Bitcoin led IGV lower.
It works the other way around as well.
At point 2, Bitcoin made a higher low relative to the pullback in IGV. That positive divergence in Bitcoin’s price led the rebound in IGV.
With all that in mind, here’s the important part: Something is breaking in the correlation.
IGV is soaring since April 10…jumping as much as 44% in that timeframe. But Bitcoin is not confirming the move. Here’s the updated chart.
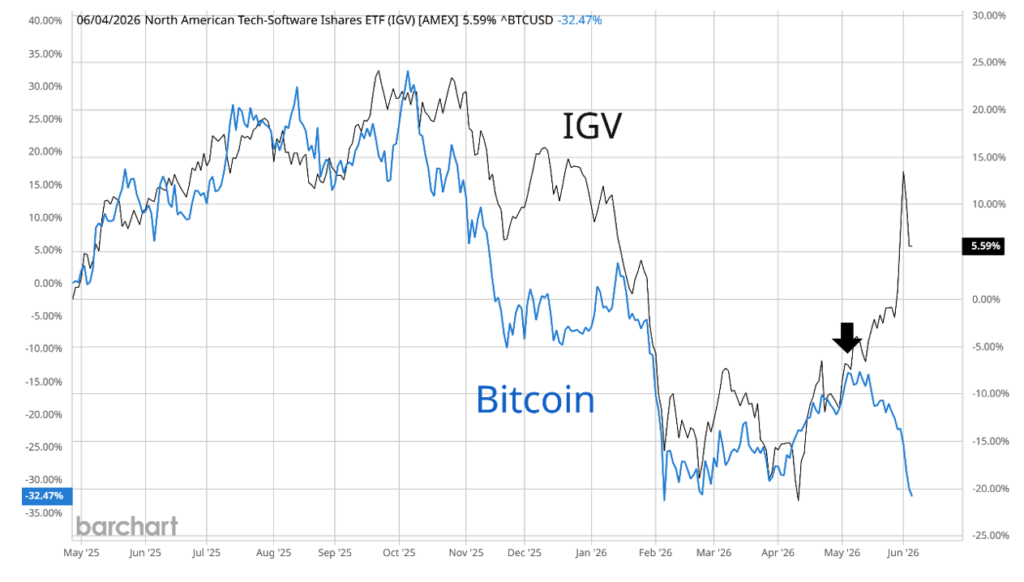
You can see the diverging price action between Bitcoin and IGV at the arrow. That’s the biggest breakdown in the correlation between the two sectors we’ve seen in years.
If Bitcoin once again leads software, then the message is clear: Anybody that’s been riding the software rebound should lock down profits now.
Read the latest insights from the world of high technology.
SMH fell 6.4% in the three days following the Kimi K3 release. Here’s why you shouldn’t worry…

This chart is a tried-and-true gauge of crypto’s risk appetite…

The selling in technology and semiconductor names over the past several weeks has been violent. That type of behavior...