




AI Is Hungry
The GPUs are being deployed in a timely manner. What isn’t arriving fast enough is the electricity to power...



This is the market giving us a chance to buy the leaders after a forced reset.

By Joe Withrow, Senior Analyst, Brownstone Research
On July 2, Tesla (TSLA) reported its best-ever second quarter by raw delivery count.
The company delivered 480,126 vehicles, which represented a 25% increase over the same quarter last year. What’s more, Tesla’s delivery count came in about 74,000 units above Wall Street’s expectations.
By almost any conventional measure – units, growth rate, beat size relative to expectations – this was an incredibly strong operating quarter for Tesla. And it was driven by a genuine recovery in European demand and the working down of an inventory overhang that had weighed on the stock earlier in the year.
Yet Tesla fell nearly 7.5% on the news. It was the stock’s largest single-day drop in roughly a year.
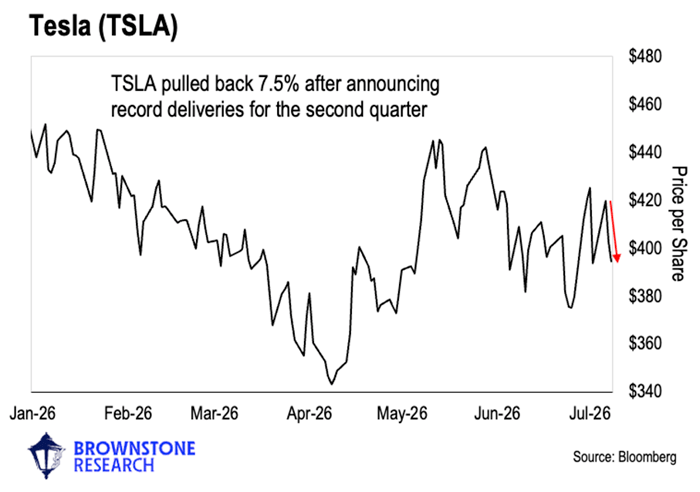
On the surface, this seems irrational. But if we expand our view, this is quite telling.
For most of the company’s history, Wall Street has viewed Tesla as an electric vehicle (EV) company. And as with any EV company, delivery count is viewed as a key metric.
The market’s lackluster response to Tesla’s record second-quarter deliveries suggests that it has finally caught on to something that Jeff Brown has been saying for a decade now: Tesla is not an EV company. It’s an artificial intelligence (AI) company that just happens to sell electric vehicles.
If the market has awakened to that reality, we can expect Tesla to trade alongside market sentiment for AI and robotics going forward. We can expect the market to focus on any news around Tesla’s full self-driving advancements, its robotaxi rollout, and the rise of its humanoid robot Optimus.
This is also a useful pattern to watch for a growing number of companies that are pivoting to an AI-first business model right now. More and more tech companies will be priced for a specific multi-year AI-driven outcome rather than their historical fundamentals.
This isn’t yet a trend, but it’s something to watch. If we start to see quarterly earnings “beats” consistently become a “sell the news” event, we’ll know why.
By Nick Rokke, Senior Analyst, Brownstone Research
Wall Street just gave long-term investors another chance to buy one of the strongest trends in the market.
After leading stocks higher for months, the market’s momentum leaders have finally pulled back over the past couple of weeks. This has some people calling a top in the market. But what we’re seeing looks less like the end of the trade and more like a reset.
Momentum is one of Wall Street’s most closely watched “factors.” It’s a fancy way of describing stocks that are trending in a direction. Typically, when we talk about momentum, we are talking about companies that have been moving higher and outperforming the broader market over a recent period.
Academic research has shown that stocks that are leading often keep leading. This is why trend-following strategies have been around for decades.
One way to track this group is through the iShares MSCI USA Momentum Factor ETF (MTUM). This fund purchases stocks that fit the momentum profile. And right now, that means it has heavy exposure to the strongest area of the market – semiconductors.
That should not surprise us. Artificial intelligence has created enormous demand for chips, memory, storage, networking equipment, and data center infrastructure. That demand has pushed several semiconductor and hardware-related stocks sharply higher.
Since the market bottomed at the end of March, MTUM vastly outperformed the S&P 500. At its peak, it had gained nearly 50%. But over the last couple of weeks, that leadership faded. And now investors are asking the obvious question: Is the momentum trade over?
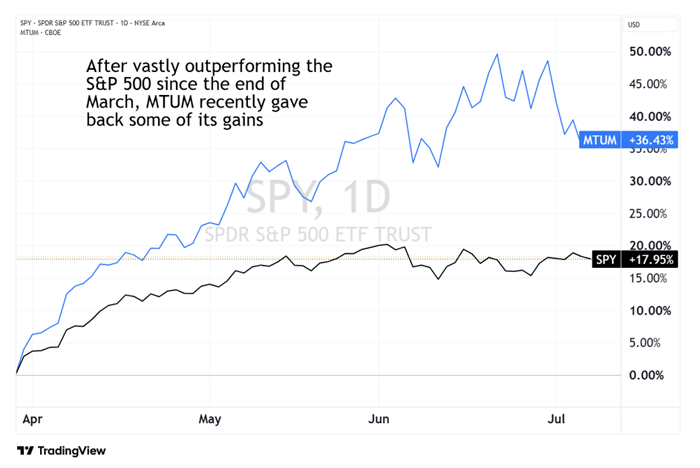
I see two reasons momentum stocks have struggled.
The first is interest rates. Momentum stocks began to stall after Kevin Warsh’s first meeting as Federal Reserve chair. The tone from that meeting was more hawkish than investors expected. That pushed interest rate futures higher.
High-momentum stocks are sensitive to changes in rate expectations. When rates move higher, investors often reduce exposure to the fastest-moving parts of the market.
That is what we saw. Semiconductor stocks took a breather.
But the bigger move came at the end of June when quarter-end portfolio rebalancing hit the market. Many investment funds have mandates requiring them to rebalance their holdings at the end of each quarter. The purpose is to prevent any one position (or sector) from becoming too large inside the portfolio.
That sounds harmless… but when a group of stocks has surged, rebalancing can create heavy selling pressure. And in the second quarter, semiconductor stocks surged 88%. That’s an extraordinary move in just three months. But the bigger the gain, the bigger the rebalancing.
The selling triggered stop-loss orders from short-term traders, which led to even more selling. But the cause was not collapsing demand or a failed AI thesis. It was Wall Street mechanics.
Now that the portfolio rebalancing is largely over, the forced selling is stopping. And buyers are stepping in.
One clear signal is in memory stocks. Some of the hottest stocks this year have been tied to memory. That includes Micron (MU), Sandisk (SNDK), and Seagate (STX), among others. These stocks are tracked in a new ETF called Roundhill Memory ETF (DRAM).
The chart below shows that the selloff at the end of June. But it stopped at the 50-day moving average (purple line). This is a level many institutional investors watch closely. When strong stocks pull back to this level during an uptrend, big money typically steps in to buy the dip. And they have.
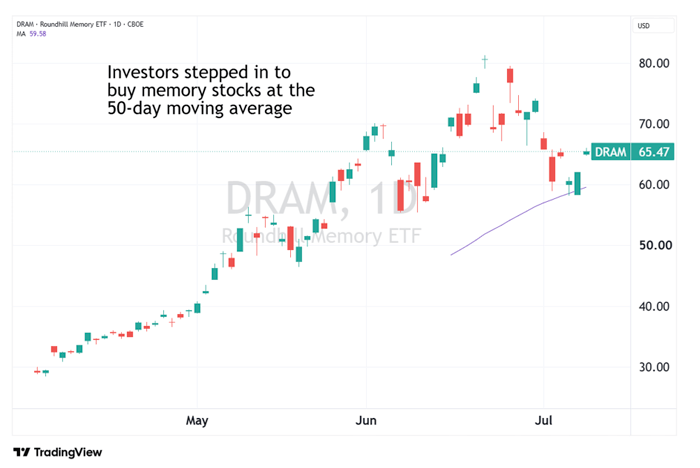
This is not the time to panic out of the AI infrastructure trade. This is the market giving us a chance to buy the leaders after a forced reset.
This is a good point for long-term investors to initiate or add to positions in their portfolios. That’s what I’m doing.
By Jason Bodner, Founder, Outlier Intel
We recently capped off a volatile, bumpy June. But looking at the daily returns of the SPY – the S&P 500-tracking ETF – you wouldn’t know it. The average daily return for June was 0%. However, peak to trough was 4.7%.
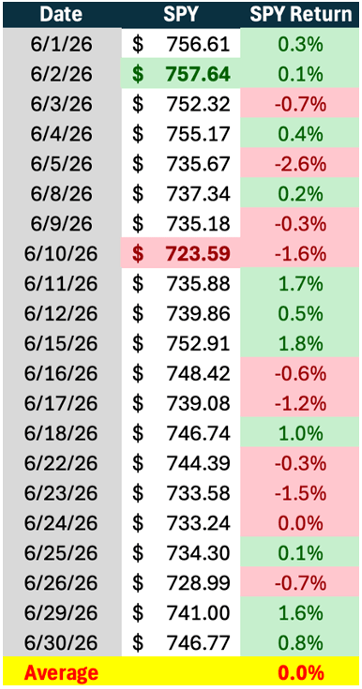
All told – SPY ended down 1% for the month.
What I noticed most was that some of the FOMO that’s been driving things higher this year came out of the system. Stocks wobbled, the back-and-forth over the Iran war pumped up the volatility, and worry over inflation and rates continued to weigh on the minds of investors.
SpaceX saw downward pressure after its historic IPO. The stock popped to $225.64 and has fallen roughly 30% since. While that may seem disconcerting, it fits the pattern of many IPOs.
Even META (previously Facebook). It IPO’d at $38 in 2012, peaking at $45. Then, it was a one-way street down 54% peak-to-trough. When it bottomed, Facebook was worth just $41.8 billion in market capitalization. Today the company is worth $1.56 trillion – a roughly 37-fold increase.
In short, don’t get too swept up in the post-IPO performance of SpaceX. I, for one, am quite bullish on SpaceX given Musk’s track record alone, especially given his clear dominance in the space race. My point is that there was a lot of excitement heading in – far less afterwards. Couple that with a stalling stock market and tiresome headlines, and I am not surprised June was ho-hum.
It’s something of a pattern with June. Going back 35 years, since 1990, my research shows the S&P 500 has an average June return of just 0.12%, with just 57% of those Junes being positive. In other words, there wasn’t much to expect in the first place.
Contrast that with July. Since 1990, 66% of them were positive, to the tune of 1.46% for the S&P 500. History shows us July is more exciting than June.
In either case, the “sell in May and go away” trope may not be the best advice. If anything, I’d say, “Sell August 1st, Buy October 1st”…
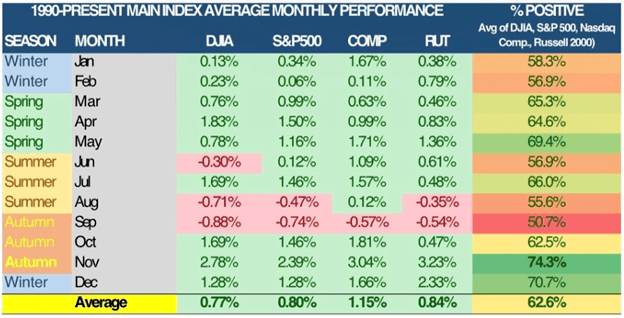
But I wouldn’t even say that. Volatility is something we have to deal with as investors. Just like we all have days where everything seems to go wrong. We deal with it. The long-term trend is up!
Add Brownstone Research as your preferred source on Google to see our latest stories in your feed.
 Add as a preferred source
Read the latest insights from the world of high technology.
The GPUs are being deployed in a timely manner. What isn’t arriving fast enough is the electricity to power...


There’s one metal named in the procurement rules that hasn’t seen a major deal…yet.