



Bessent Finds His Buyer
Fortunately for Bessent, there’s one group of buyers with a voracious appetite for short-term U.S. debt.



Let’s not confuse a temporary correction with the end of the bull market…


Two completely different markets are unfolding at the same time.
The Nasdaq-100 just entered correction territory, falling more than 10% from its early-June peak.
That sounds ominous. But it may be one of the most misleading headlines in the market right now.
The Nasdaq-100 is market-cap weighted. The larger a company becomes, the more influence it has on the index.
Apple, NVIDIA, Microsoft, Amazon, and Alphabet together account for roughly one-third of it. When those giants fall, they can make the entire market appear weak – even while hundreds of other stocks move higher.
That is exactly what is happening.
Look at the S&P 500 Equal Weight Index. Instead of allowing the largest companies to dominate, it gives roughly the same weight to every stock in the S&P 500.
Earlier this week, the Invesco S&P 500 Equal Weight ETF (RSP) broke out to a record high even as the Nasdaq-100 sold off.
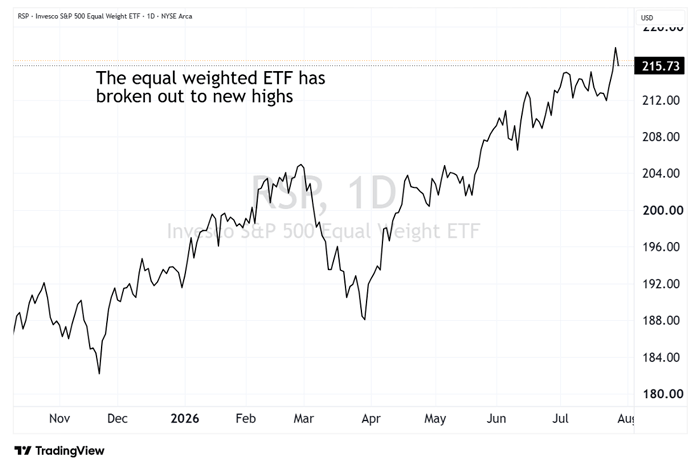
That is not a market running for the exits. It is a market rotating.
After a historic run in semiconductors and other AI-linked names, capital has moved into health care, consumer staples, financials, and other areas that had been left behind. This is healthy. It allows the hottest parts of the market to cool off while new groups carry the indexes higher.
More importantly, it tells us investors are not abandoning stocks. They are simply changing where they are putting their money.
But sector rotations do not change where the strongest long-term growth is taking place. They give investors a chance to reset expectations, shake out weak hands, and prepare for the next leg of the trend.
And the earnings data tells us the AI buildout is still accelerating.
Alphabet reported 24% revenue growth last quarter, while Google Cloud revenue surged 82%. Its cloud backlog reached $514 billion, and management raised its 2026 capital spending outlook to $200 billion because demand for AI infrastructure continues to exceed available supply.
Microsoft told the same story. Azure revenue rose 43%. The company added 31 data centers during the quarter and 88 over the full fiscal year.
Yet Microsoft’s commercial backlog – the contracted revenue it has not yet recognized – reached $678 billion. It spent $41 billion on capital expenditures during the quarter and expects that figure to exceed $50 billion in the current quarter.
In other words, these companies are bringing enormous amounts of new capacity online… and customers are consuming it faster than they can build it.
And capital expenditure (capex) spending will continue to grow…
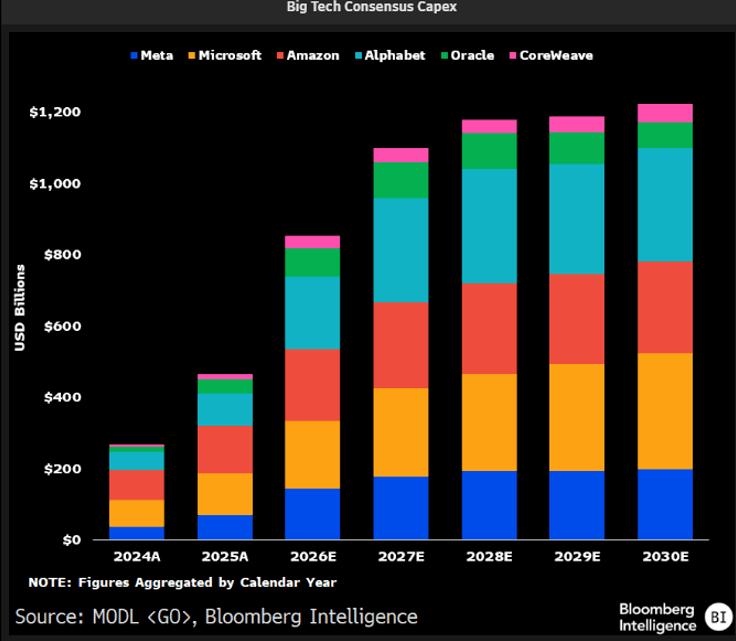
The chart above shows consensus Big Tech capital spending climbing above $1 trillion annually and continuing higher through 2030. And that forecast may still prove conservative as AI agents, autonomous systems, and eventually artificial general intelligence demand more compute, memory, networking, and power.
So don’t confuse a correction in a concentrated technology index with the end of the bull market.
The market is broadening. AI demand is accelerating. And the hyperscalers are still raising their spending plans.
This rotation is not the end of the AI trade. It is the setup for its next leg higher.
Something deceiving is happening on the surface of the stock market.
The Nasdaq-100 Index is falling into correction territory with a 10% decline from the early June peak. But the average stock is marching ahead.
The Invesco S&P 500 Equal Weight ETF (RSP) treats each stock in the S&P 500 equally instead of the cap-weighted version, where stocks with a higher market value receive a greater weighting.
RSP rallied to its highest level ever seen this past Wednesday… just as the Nasdaq fell into a correction. You have to go back to 2001 to find another instance of the Nasdaq entering a correction while the average stock in the S&P 500 rallied to a record.
The date is important, and I’ll come back to that in just a moment.
The difference in returns is just another example of a jump in return dispersion this year. That’s just a fancy way of saying that returns across different stocks, sectors, and industries are jumping all over the place.
There are a few ways you can measure return dispersion. One way is to compare the volatility of an index to the average volatility of the stocks that make up the index.
Another way to look at the difference in returns across sectors. Bloomberg recently put out a chart showing the total number of weeks in any given year where the performance between S&P 500 sectors was greater than 10%. A large difference in sector returns points to considerable turbulence beneath the market’s surface.
Here’s the chart.
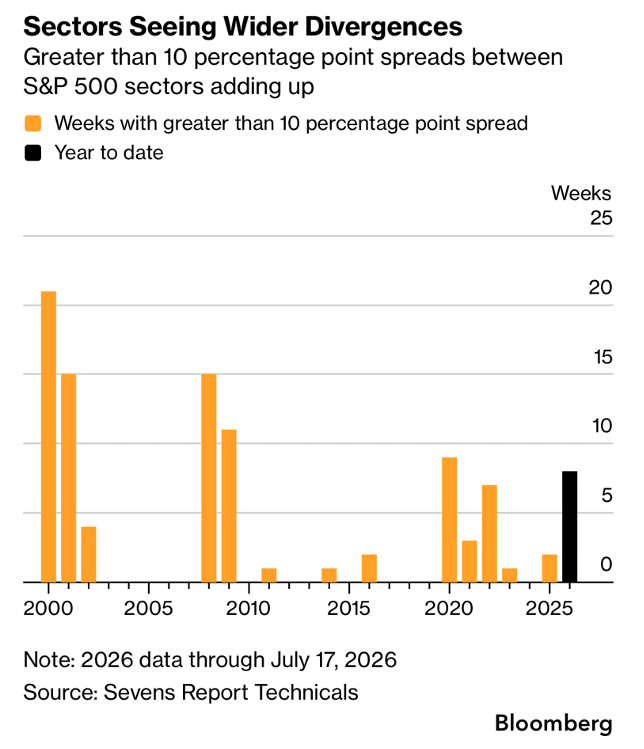
So far in 2026, we’ve seen a growing number of weeks with that 10% spread between sector performance. It’s the largest figure since the pandemic selloff in 2020.
Now let’s talk about those dates again. Look at the years in the chart where you see a spike in sector return dispersion.
In addition to 2020, the bear market year in 2022 saw a spike. So did 2008 and 2009 during the financial crisis. Before that, large spikes were seen during the years around the early 2000s internet bubble bursting.
Putting it all together, here’s what it means for the stock market and your portfolio…
Return dispersion tends to spike during years of transition – from bull market to bear market. Price action gets turbulent under the hood when uncertainty is rising.
But the indexes can also be deceiving. I noted earlier that while the Nasdaq fell into a correction, the average stock is pushing ahead.
That means investors used to the easy gains of the past few years by simply holding ETFs tracking the S&P 500 or Nasdaq-100 need a more active approach to find the best opportunities. Environments featuring high return dispersion are great for active traders.
We just alerted subscribers in One Ticker Trader to lock in gains on RSP that we recommended earlier this year. High return dispersion means plenty more opportunities should be waiting ahead.

Over the past three weeks, the iShares semiconductor index (SOXX) has shed more than 20% from its June high. Micron fell 13% in a single session, erasing roughly $138 billion in value before lunch. Intel dropped 9%. AMD dropped 7%.
The trigger? SK Hynix said it would delay part of its HBM4 expansion to make room for higher-margin DDR5 production. Add a Federal Reserve that suddenly sounded less like a friend and more like a landlord, and the tape cracked.
Jim Cramer put it best. He said the sellers behind this move are “monstrous, motivated and often margined.”
That last word is the whole story.
Margined.
Here’s what most headlines won’t tell you: FINRA margin debt just hit a record $1.53 trillion in June. That’s up 7.9% in a single month. It’s up somewhere between 51% and 54% from a year ago.
Since FINRA started tracking this in 1997, there have only been three other stretches where margin debt grew this fast, this quickly: late 1999 into early 2000. Spring 2021. Mid-2007.
I don’t need to tell you what came next each time. You already know.
Here’s the part that matters most: margin calls don’t read earnings reports.
They don’t care that Micron’s revenue beat estimates. They don’t care that data center buildouts are still accelerating. A margin call is a math problem, not an opinion. The broker says “wire more cash or we sell your stock,” and the stock gets sold, good business or not.
And when forced selling starts, it doesn’t politely pick its targets. It hits whatever is most liquid and has run up the most. Right now, that’s chips.
So before you panic, ask yourself the questions that actually matter.
Are hyperscalers canceling data center builds? No, they’re still racing to add capacity.
Is AI memory demand disappearing? No, SK Hynix isn’t walking away from HBM because nobody wants it. It’s shifting mix because DDR5 pricing got even better. That’s a company chasing more profit, not less demand.
Did the business change, or did the stock just get sold by someone who had no choice?
I’ve asked myself that exact question before, sitting through a 60% drawdown in a stock I still believed in… Nvidia (NVDA). It’s an awful feeling. But nine times out of ten, the answer is the same: the story didn’t break. The leverage did.
Now, this doesn’t mean every chip stock bounces back when the dust settles. Some won’t. Leverage has a way of exposing which companies were only ever a story, and which ones actually had the earnings to back it up.
It also doesn’t mean a crash is imminent… this isn’t 1999. Back then stocks traded at astronomical valuations. In fact, many were infinite, in that many dot-coms had no sales or earnings at all. And 2007 later saw a leverage bust of yield-hungry investors on a housing market that had to go up until it didn’t.
This is not like those times. This is a summer doldrum on the heels of an astounding market rally. Add to it a midterm election in November, and the shadow of uncertainty has cast itself over the land.
But a margin-driven flush and a broken thesis are not the same event. One is about who owns the stock. The other is about whether the business still works.
Mark Twain said it better than I ever could: “There are two times in a man’s life when he should not speculate: when he can’t afford it, and when he can.”
Somewhere out there right now, a lot of people are learning that lesson the hard way.
Add Brownstone Research as your preferred source on Google to see our latest stories in your feed.
 Add as a preferred source
Read the latest insights from the world of high technology.
Fortunately for Bessent, there’s one group of buyers with a voracious appetite for short-term U.S. debt.

Stocks were climbing out of bear territory, but then the bond market spoke up.

These factories will cost billions before even a single working chip is produced…