



Symptoms of a Split Market
Indexes look great, your brokerage statement may not.



That deadline still looms large, and if China says yes to those export controls, metals supply in America and the West gets a lot tighter overnight.

Managing Editor’s Note: The Dollar Trap airs tonight…
This evening, our colleague Larry Benedict is sitting down with Jeff Brown for an emergency briefing where they will reveal why the U.S. dollar is in an inescapable trap that not even the president himself can stop from snapping shut.
They will also show why the winners of the AI boom could effectively lose up to 40% of their gains in the aftermath… and how you can turn this chaos into profits if you know how to tackle it.
Just go here to automatically add your name to Larry’s guest list for tonight at 8 p.m. ET.

The critical metals and wider natural resource markets have been largely unaffected by rising interest rates in the U.S.
Fears that the Fed rate hike might sink commodity prices vanished amid buoyant trading. Just look at the critical metal copper, which rallied as much as 6.5% since the Fed announced a quarter-point rate increase on September 16.
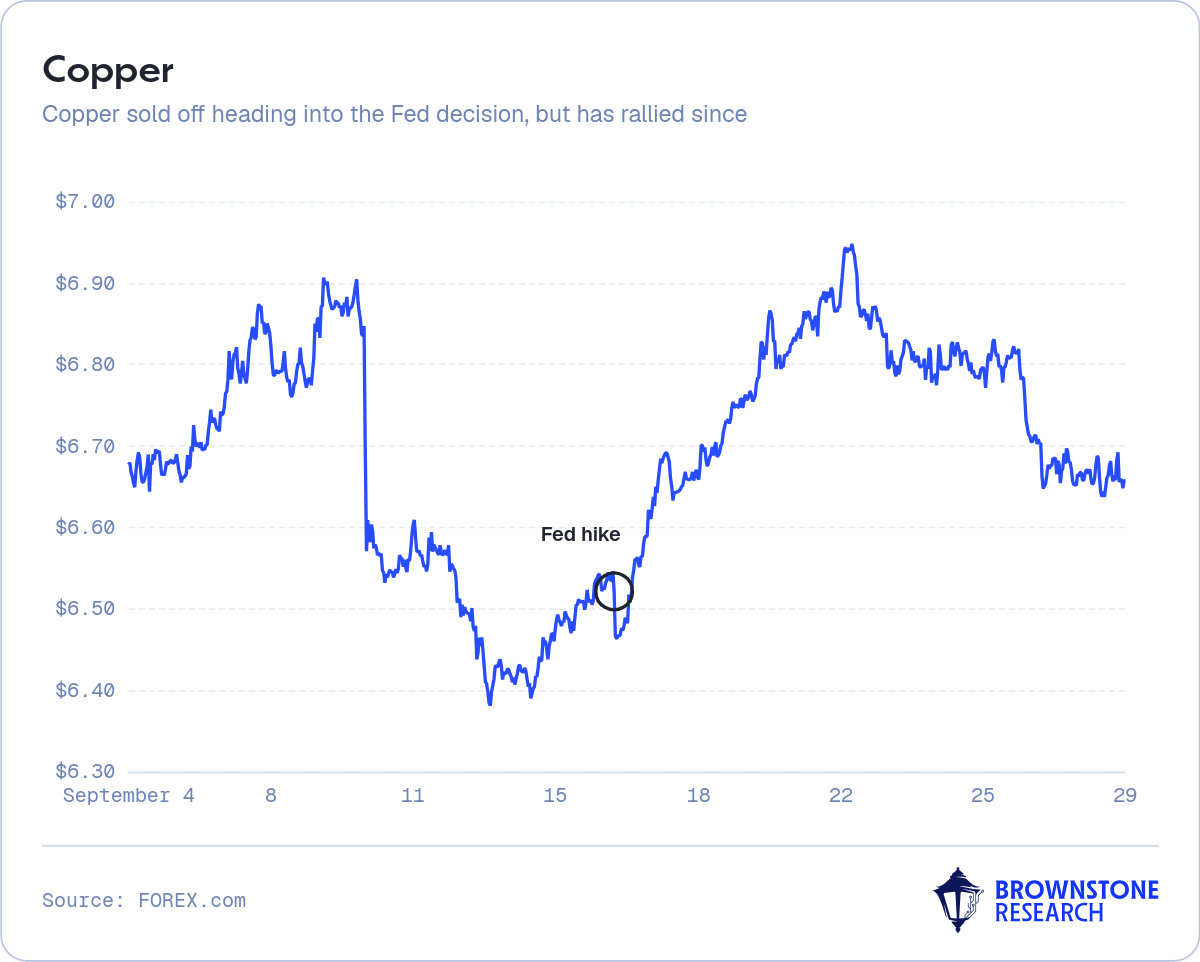
Critical metals stocks have also been very active over the past week. Last Monday, Greenland-based mining stocks soared on the announcement of a U.S.-Denmark security deal covering the Arctic island.
Stocks such as Greenland Mines rose nearly 540% in just two days. Critical Metals Corp jumped 37% on the news.
We expect these tailwinds for critical metals and associated stocks will continue, especially because we’re approaching some key deadlines for tech metals.
Most immediate is the January 10, 2027, decision by China on whether it will implement metals export restrictions introduced in 2025 but subsequently delayed 12 months.
Originally, China was slated to make a decision on extending export controls this coming November 10. But at last week’s summit between Presidents Trump and Xi, the two sides agreed to push that out by two months.
That deadline still looms large, and if China says yes to those export controls, metals supply in America and the West gets a lot tighter overnight.
Concerns over such a scarcity scenario almost certainly played into blockbuster deals such as the Greenland pact, as well as a $2 billion financing package announced earlier this month by the Department of War for the critical metal tungsten.
In short, there’s a lot of money being deployed quickly into tech and defense metals all over the world. America even went as far as the West African nation of Niger earlier this month, when it announced a $400 million financing package for a uranium mine.
Another major deadline coming sooner is January 1, 2027. That’s when new purchasing rules will take effect at the Department of War, effectively barring purchases of metals produced or processed in China.
Those restrictions mean defense buyers and suppliers are scrambling right now to find metals supply outside China.
All of this suggests one thing: Resource stocks – especially those that can provide homegrown supply – should remain buoyant… rate hikes or no.

It has beaten Bitcoin’s own returns 6-to-1… 9-to-1… and even 22-to-1. And you never buy, sell, or own any cryptocurrency. Everything runs from a standard brokerage account. A former top 1% hedge fund manager explains the entire method in a free video, full instructions included. Watch it here.

The U.S. dollar is approaching the biggest disaster in over 50 years… on a deadline set by the federal government. Jeff Brown and Larry Benedict say the dollar won’t weaken. It will break.
For the prepared, it could be the opportunity of a lifetime – in a market that’s delivered gains like $11,475 in 28 days. They explain everything in a free emergency broadcast on TONIGHT, at 8:00 p.m. ET. Click here to reserve your seat.

The end of summer is great news for Bitcoin investors.
Let me show you why…
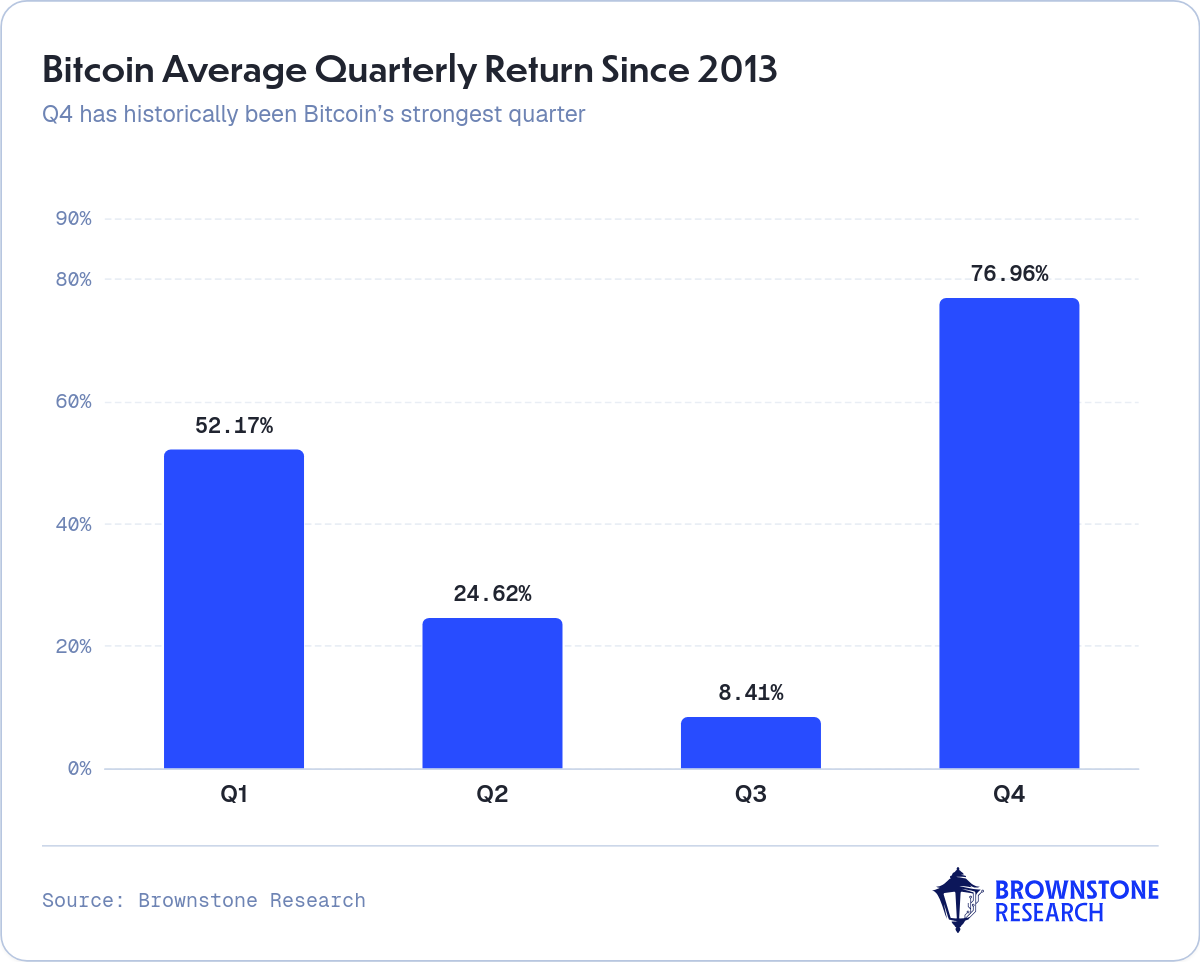
Below is a chart that shows us Bitcoin’s average historical performance by quarter since 2013.
This upcoming season has historically been far and away the most bullish time of year for Bitcoin. It’s returned an average of +76.96% in the final three months of the year.
This Bitcoin seasonality lines up with the documented seasonality trends of the stock market. Here’s how the S&P 500’s performance has looked per quarter going back to 2010:
There are several explanations for this pattern. The underperformance of Q3 is usually attributed to thinly staffed trading desks, resulting in lower volume that causes bad news to have outsized effects on the market. Contributing factors to Q4’s performance are year-end retirement contributions and paid bonuses being deployed into a lower stock market coming out of September, the worst month for the S&P 500 on average.
Whatever the reasons, the demonstrated seasonality for stocks also holds true for the world’s first cryptocurrency. That matters because we’re entering that period right now.
What’s most exciting about this upcoming period is how much confluence we’ve witnessed that signals a strong end of the year.
Not only does the crypto market have this seasonality effect working in its favor, but there are also the various technical, fundamental, and order-flow factors we’ve been tracking both here and in Chain of Thought each week that are also working in its favor.
Last week, for example, we highlighted the massive technical breakout BTC made after the SEC rolled out its own rule sets for digital assets following the CLARITY Act’s failed cloture vote.
Below we’ll see how, despite running into strong resistance at the 2026 yearly open level around $88,000, the asset still managed to register its second consecutive weekly close above the crucial 50-week moving average we’ve been closely monitoring here.
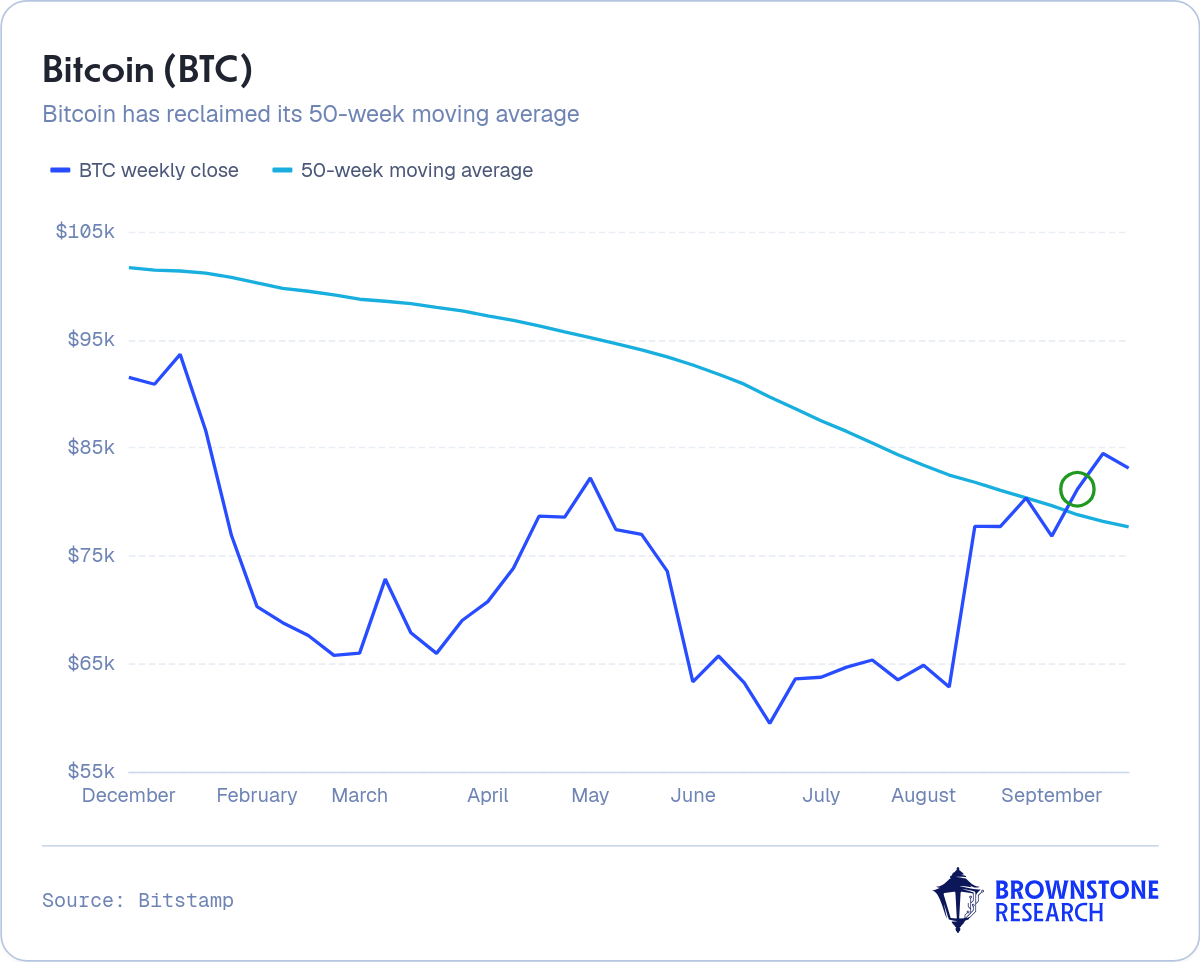
This suggests the current pullback is a sign of healthy consolidation into September’s end.
As exciting as the past six weeks have been, it’s easy to forget that it was only mid-August when BTC was trading in the low $60,000 region.
The market will likely need a little bit of time to digest the massive move realized in recent weeks while awaiting the next catalyst that will send it back up for a retest of the $90,000 level.
As for what that catalyst may be, we suspect it could come from the CFTC rather than the SEC.
Last week, we noted that the commission sent its proposed framework for digital assets to the president’s team for review.
Its filings, titled “Regulation Crypto Asset Transactions” and “Regulation Crypto Asset Markets,” are currently on the desk of the White House’s Office of Information and Regulatory Affairs (OIRA), undergoing review.
Once that process is finished, we’ll get some more insight into what the CFTC has outlined in its proposed rule sets.
That’s a catalyst that could come any day now and provide the spark the market needs to take the next leg higher and follow its typical Q4 pattern of outperformance.
As always, we’ll be watching closely to see how things develop from here…

The moves in U.S. Treasurys over the past week or so were dramatic.
In just two days, the U.S. 10-year Treasury yield surged from around 4.94% to just over 5.22%. The 30-year also climbed sharply, breaking through 5.5%. Those are extraordinary moves in such a short time.
When Treasury yields are rising (and bond prices are falling), demand can start to dampen in the economy. The cost of borrowing money increases, including for mortgages and business loans.
That said, rising yields don’t necessarily mean that the Fed can just sit on the sidelines. At the time of writing, the CME FedWatch tool is putting the odds of a quarter-point Fed rate hike at around 68% at the Fed’s October meeting.
But those odds could shift based on a slew of key data coming this week. Once again, both inflation and the jobs market are front and center.
The major jobs focus will come on Friday with the release of September’s nonfarm payrolls (NFP) report plus the latest unemployment reading. After last month’s big NFP beat – when new jobs came in 106,000 above expectations – signs of further job strength could put more pressure on the Fed.
Turning to inflation, August’s Personal Consumption Expenditures (PCE) price index – the Fed’s preferred inflation gauge – arrives today. Any surprise to the upside could increase the odds of an October hike.
Then, there’s Manufacturing Purchasing Managers’ Index data, which has been trending higher for most of this year. The July reading was the highest in over four years.
Last week’s big beat in the manufacturing survey caused Treasury yields to surge and stocks to weaken. It was the highest reading since May 2022.
Another strong result would indicate that the economy remains resilient. From the Fed’s perspective, that could mean the economy is capable of absorbing another rate hike if needed.
The S&P 500 remains vulnerable to a sharp move if the data surprises in either direction.
The job for traders will be to watch the action closely and be ready to act quickly when the best trading opportunities emerge.
Add Brownstone Research as your preferred source on Google to see our latest stories in your feed.
 Add as a preferred source
Read the latest insights from the world of high technology.
Indexes look great, your brokerage statement may not.

The Fed’s job is to turn down the fun before the market drives its car into a ditch...

We should not confuse the AI opportunity with the technology sector alone...