



The AI Bears Are Wrong (Again)
On the surface, it makes some sort of sense. But this argument misses two things…


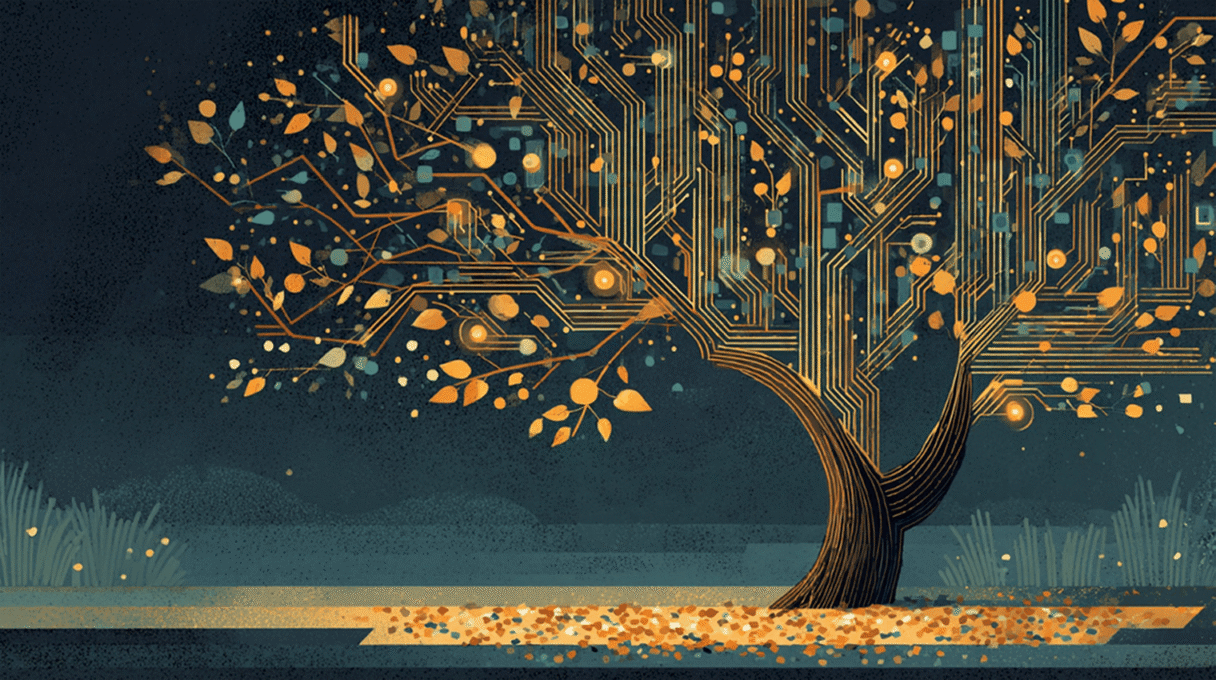
AI hardware is shedding leverage as a tree drops its leaves, but leaves come back.

Last week was a tech wreck, and it was ugly and swift.
On Thursday, the Nasdaq fell 2.6%, Meta dropped 7%, and Nvidia slid 4%. Goldman Sachs said hedge funds sold tech at the fastest pace in at least a decade, mostly by dumping shares they already owned.
This smells like deleveraging.
FINRA margin debt hit $1.48 trillion in September, up 31% from a year ago. October numbers won’t come out until next month, but our ETF data shows the fingerprints. We saw outflows from leveraged bull funds on the Nasdaq, semis, and tech, and an inflow into a 3x bear semiconductor fund.
Meta and Tesla were the trigger. Tesla trimmed its 2026 spending plans, and Meta announced a new class of nonvoting shares. Headlines called it a way to fund AI. But Meta’s own filing ties it to Mark Zuckerberg keeping control of the company and preparing for California’s proposed billionaire tax, which goes to voters on November 3. In the deal, he agreed to stay in California for eight years.
I think the headlines were the excuse, and the real goal was flushing out leverage.
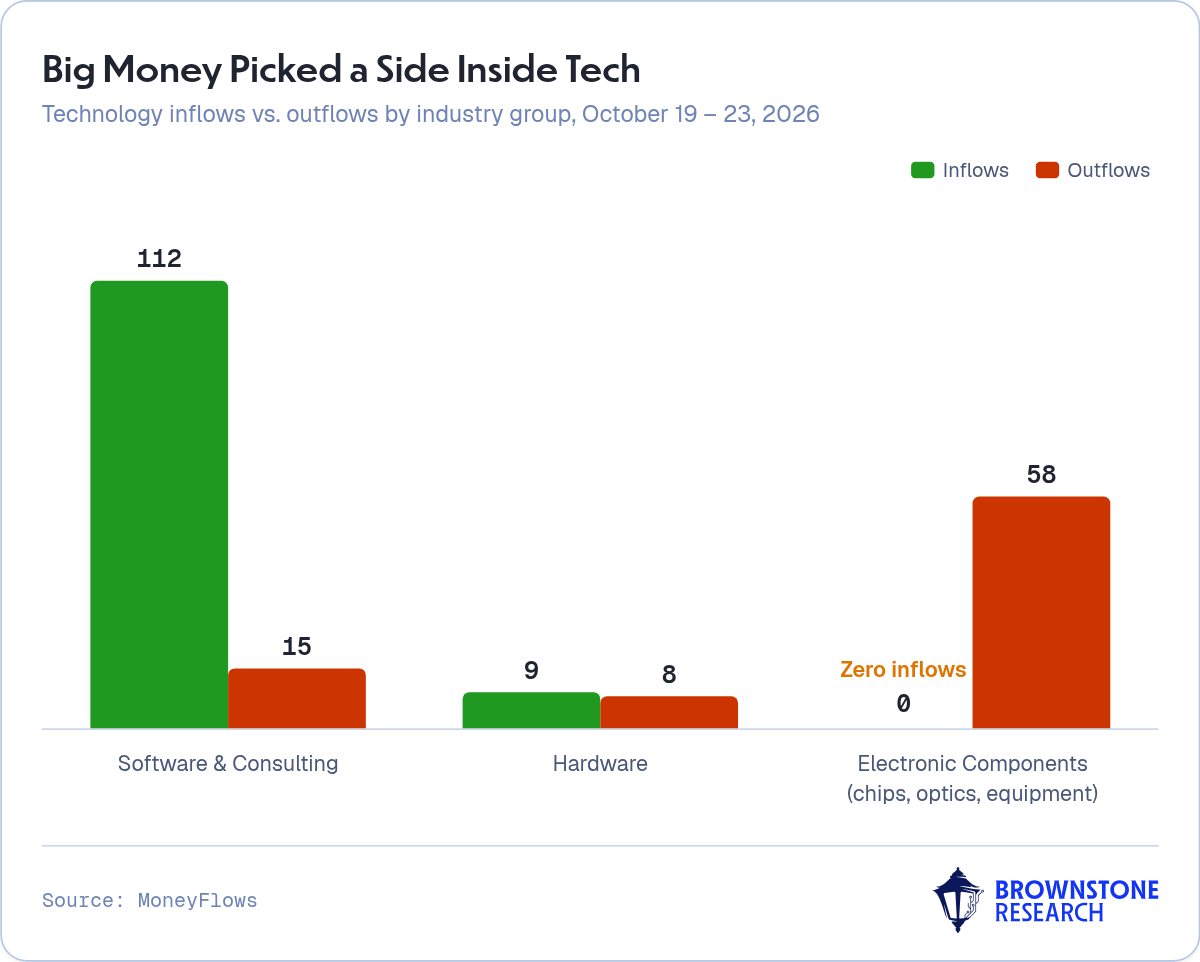
The flows confirm it. Inside tech last week, software and consulting stocks got 112 inflows and just 15 outflows. Electronic components, which includes chips, optics, and equipment, got 58 outflows and zero inflows. Not one.
Semiconductor equipment stocks are up 44.7% this year but down 20.6% in a month, and 94% of them are now in bear markets. This year’s winners were being sold to pay the bills.
So, did last Thursday wash things out? Not exactly, and that’s the encouraging part.
Big money logged 186 outflows that day on heavy volume, but also 152 inflows, the most since August 4. That wasn’t one-way panic. It was big money repositioning, selling AI hardware and buying software, healthcare, and staples.
We’ve seen this movie in past midterm years.
In 2014, the S&P 500 fell 7.4% into an October 15 low, then hit a new high 12 trading days later. In 2018, small caps fell 12.3% from August 31 to late October while the S&P 500 dropped just 5.5%, a huge rotation. In 2022, the Nasdaq-100 was down 32% for the year at its October low, then gained 36% over the next year.
2026 is following the 2022 script with a twist. This time, the tech bear is aimed only at AI hardware while the main indexes hold up.
Here’s the important part…
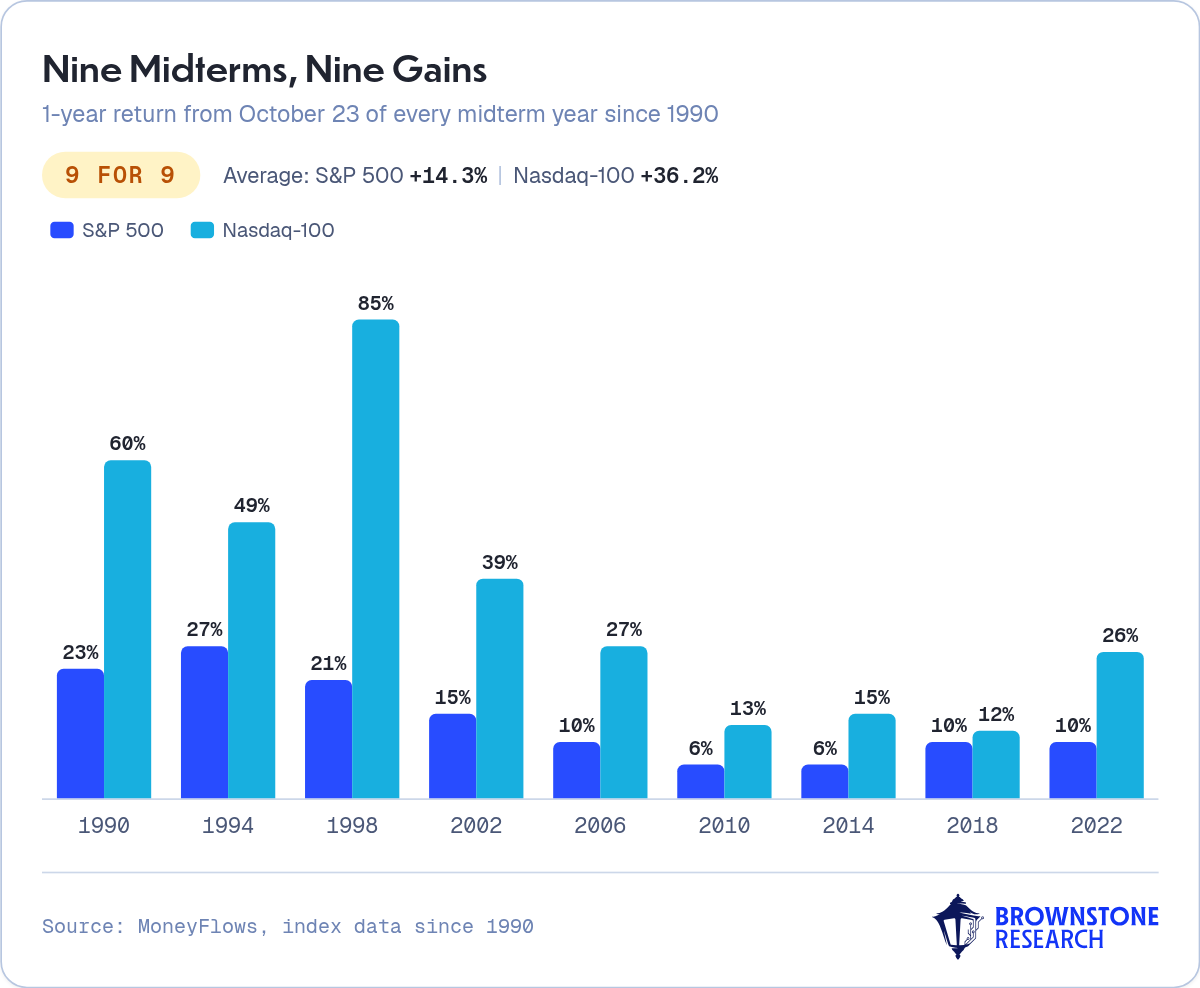
I looked at every midterm year since 1990, starting from October 23. The S&P 500 was higher one year later all nine times, with an average gain of 14.3%. The Nasdaq-100 was higher all nine times too, averaging 36.2%.
AI hardware is shedding leverage as a tree drops its leaves, but leaves come back.
Last week felt like loss. The data says it was change.

On November 4, the government could trigger a rare phenomenon. When it does, trillions will begin re-entering the markets. It's happened every four years WITHOUT FAIL since 1950. You can tap into this phenomenon and potentially make $1,245… $950… and $1,325 nearly every single week. But if you miss out, you’re locked out until 2030. Here’s how to prepare yourself for November 4.

Google’s engineers are behind another massive breakthrough: A machine that could make the cost of energy virtually free. And generate 105x growth… Now, Google’s partner is going public, perhaps as soon as December 18. Goldman Sachs and Nvidia are heavily invested. Even President Trump is expected to take a personal stake. You can get in ahead of time. And Jeff Brown will give you the ticker symbol for free. HWatch this video to get your free stock.

The most anticipated event of the week is today’s Federal Reserve meeting. Markets overwhelmingly expect the Fed to leave rates unchanged.
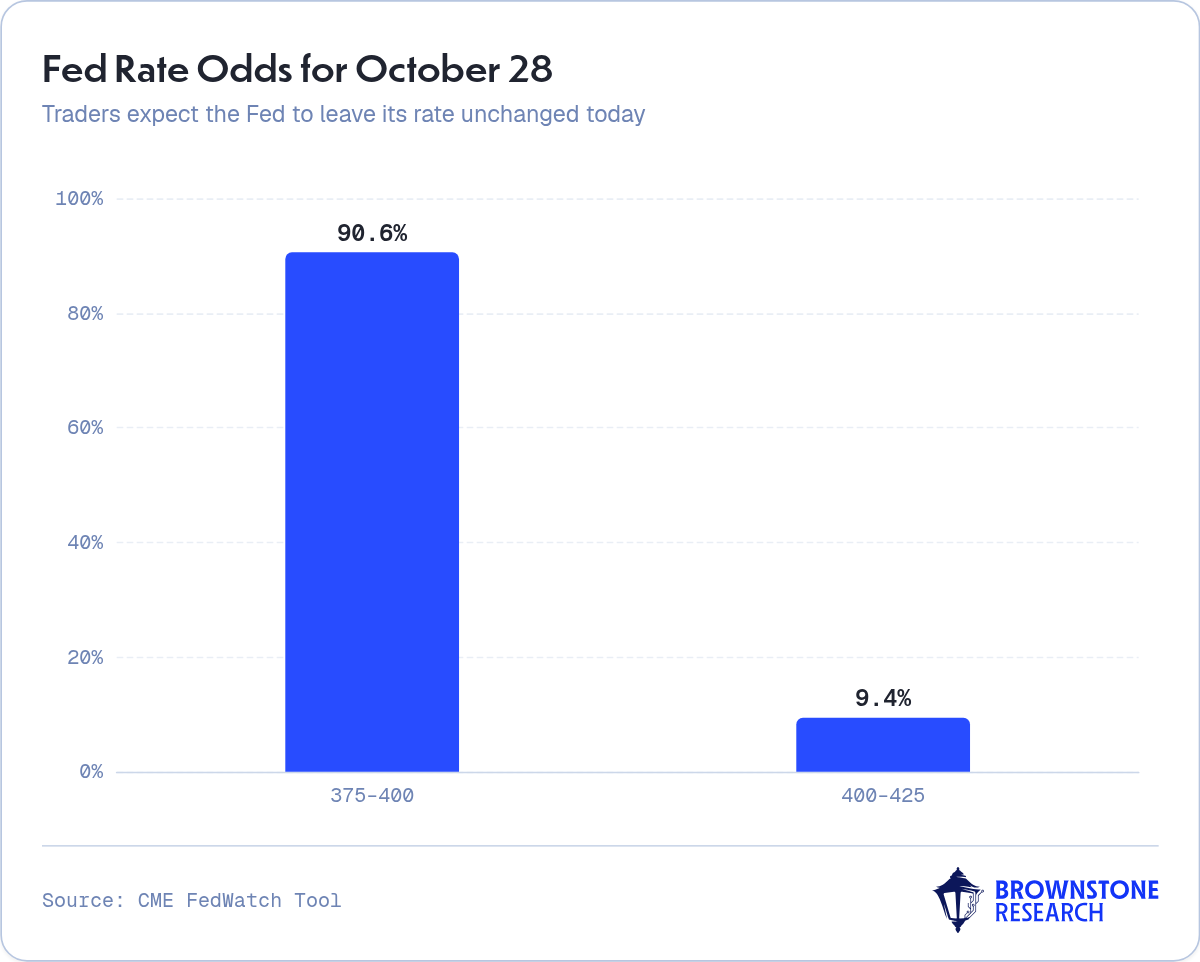
More important will be what Chair Kevin Warsh has to say about inflation and the outlook for a rate hike in December. As I write, investors are assigning a 75% probability to a quarter-point hike at year-end.
A more hawkish message could see yields recover lost ground and put renewed pressure on stocks.
Rising oil prices could add to those concerns, particularly if higher energy costs start feeding into inflation. West Texas Intermediate (WTI) settled just above $103 on Friday. Energy costs flow right through the economy, potentially forcing the Fed to keep rates higher for longer.
On top of the Fed’s announcement, we have third-quarter gross domestic product (GDP) and the Personal Consumption Expenditures (PCE) Price Index tomorrow.
The GDP numbers will give us a clearer picture of how the U.S. economy is holding up, while the PCE report will provide important insight into price pressures. Any surprises could quickly shift expectations for December’s Fed meeting, triggering volatility.
We’ve also got a big week of corporate earnings, with Microsoft and Alphabet reporting after today’s close. Amazon will share its numbers on Thursday. Given their significant weightings in the S&P 500, the market reaction to their announcements could move the broader index.
Beyond the headline numbers, investors will pay particularly close attention to AI-related capital spending, demand for their services, and what management has to say about future growth.
With so many market-moving events packed into just a handful of days, we could see some sharp swings. As always, traders should be paying attention.

Bitcoin’s wall of worry just got steeper.
That’s because the credit stress we flagged in Bitcoin’s Biggest Buyers Have Left the Building… for Now is no longer just uncomfortable… It’s reaching crisis levels.
To understand why, let’s check back in on high-yield credit spreads. As a reminder, this shows the spread between the yield on non-investment-grade (or “junk”) bonds and investment-grade bonds. It’s a way to understand how willing (or unwilling) investors are to buy the riskiest debt.
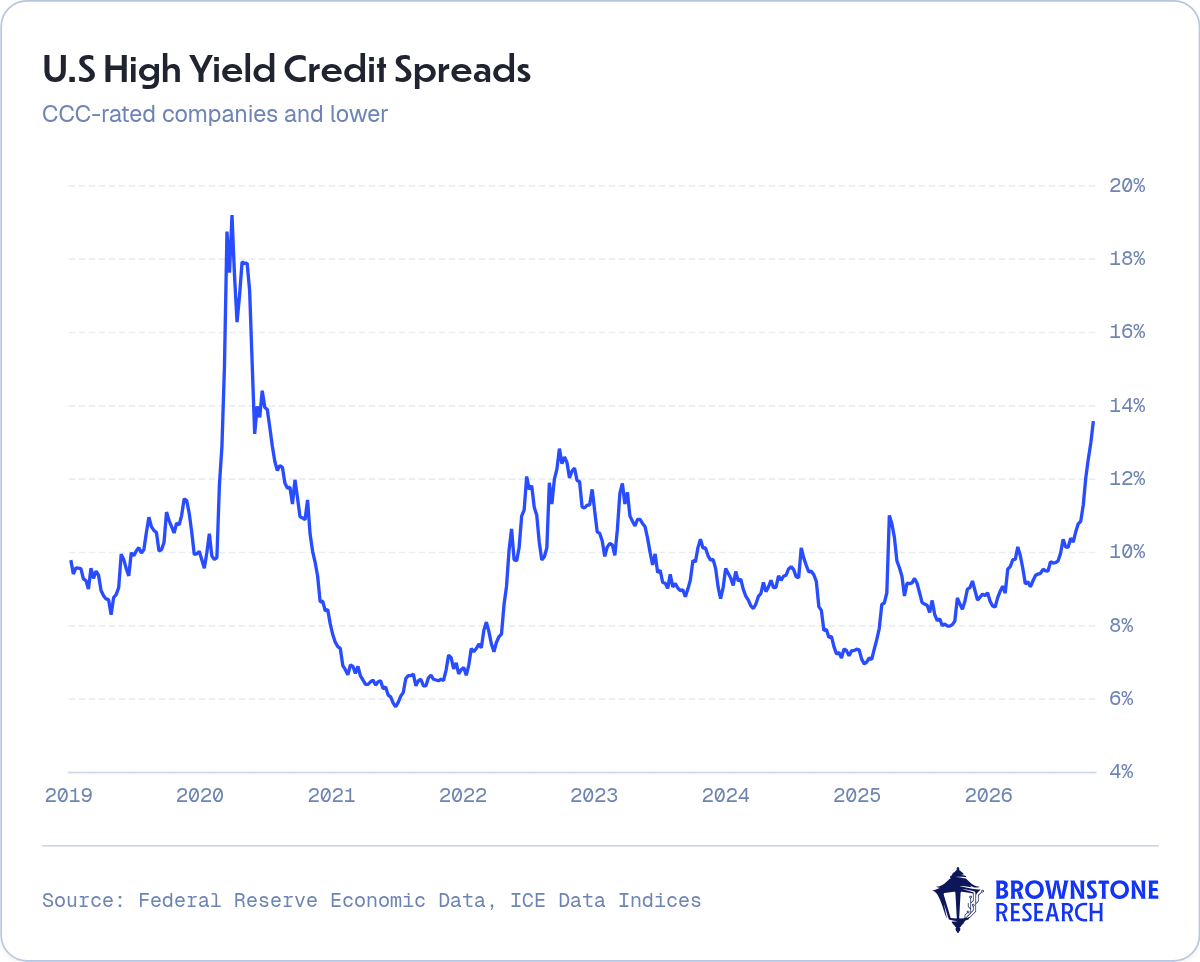
Because of their risk profile, junk bonds always pay the steepest interest rates in the bond market. But how steep is what matters.
That rate has typically been between 6% and 10% for most of the past decade. Today it sits just below 14%. And it’s up over 75 basis points in the past week alone.
It’s a move that’s brought these spreads to levels not seen since the COVID lockdowns of 2020, when the entire global economy was frozen and uncertainty was higher than ever.
Worse yet, it’s a trend that shows no signs of stopping and represents an existential risk for many of these companies.
Many of these businesses live and die by their ability to access debt at sub-10% rates. They need it to grow and refinance maturing liabilities. When spreads spike like this, refinancing can become too expensive to stomach… and that’s if it’s available at all.
As a result, only the largest corporations with strong credit and revenue can secure debt on favorable terms right now. Smaller upstarts have found themselves suddenly frozen out of financing.
If this situation stays on its current track, it’ll only be a matter of time before many of these companies begin collapsing into bankruptcy.
This chart gives us real-time insight into the market’s risk appetite… and it’s not great.
Also, these spreads act as a gauge on liquidity. When spreads become as distressed as they are now, it’s a strong signal that liquidity is restrictive.
No appetite for risk, lack of liquidity – that’s a poisonous recipe for Bitcoin.
We unpacked this dynamic at length in Chain of Thought with Bitcoin Will Hit $251,000 last month.
Until this credit stress reaches a resolution, institutions will continue cutting risk and raising cash. And one of the first assets on the list to be sold is Bitcoin.
All this is showing up in Bitcoin’s price action.
BTC recently lost its 50-day simple moving average (SMA) for the first time since August.
Should the $80,000 level now fail to hold, we’ll be watching to see if price can find support at the 50-week SMA around $75,700. If not, the 200-day SMA near $73,000 is likely the next stop.
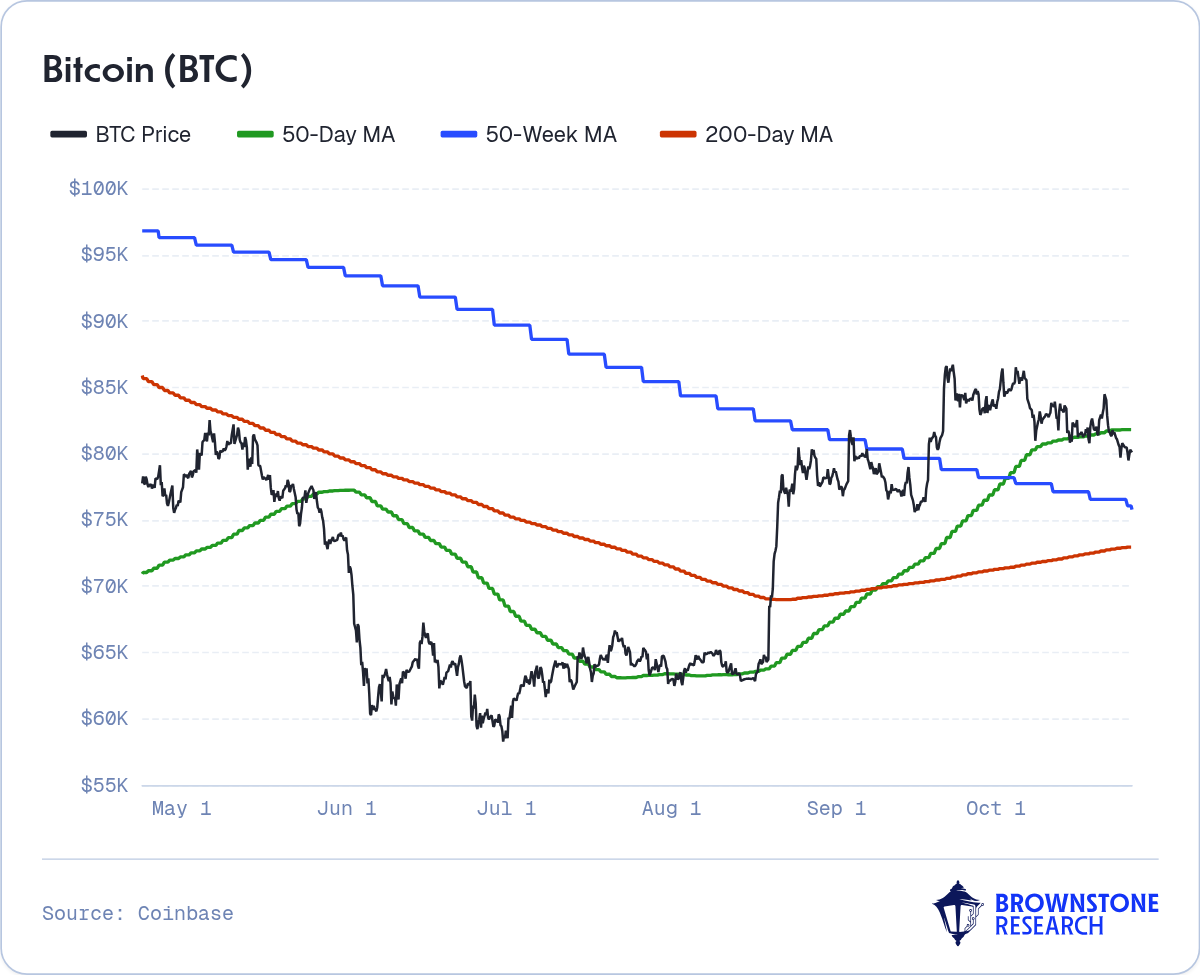
For investors with a long-term horizon, this might not be the worst outcome. You could view it as another chance to buy Bitcoin at levels not seen in months.
But make no mistake, the world’s first cryptocurrency looks to be in for a bumpy ride.
Add Brownstone Research as your preferred source on Google to see our latest stories in your feed.
 Add as a preferred source
Read the latest insights from the world of high technology.
On the surface, it makes some sort of sense. But this argument misses two things…
In South Korea, individual stock traders have an unusual nickname: gaemi, the Korean word for ants.

The GPUs are being deployed in a timely manner. What isn’t arriving fast enough is the electricity to power...